
CXC Home | Search | Help | Image Use Policy | Latest Images | Privacy | Accessibility | Glossary | Q&A
1
Sonified Images
A new trio of examples of 'data sonification' from NASA missions provides a new method to enjoy an arrangement of cosmic objects. Data sonification translates information collected by various NASA missions — such as the Chandra X-ray Observatory, Hubble Space Telescope, and Spitzer Space Telescope — into sounds.
Credit: NASA/CXC/SAO/K.Arcand, SYSTEM Sounds (M. Russo, A. Santaguida)
2
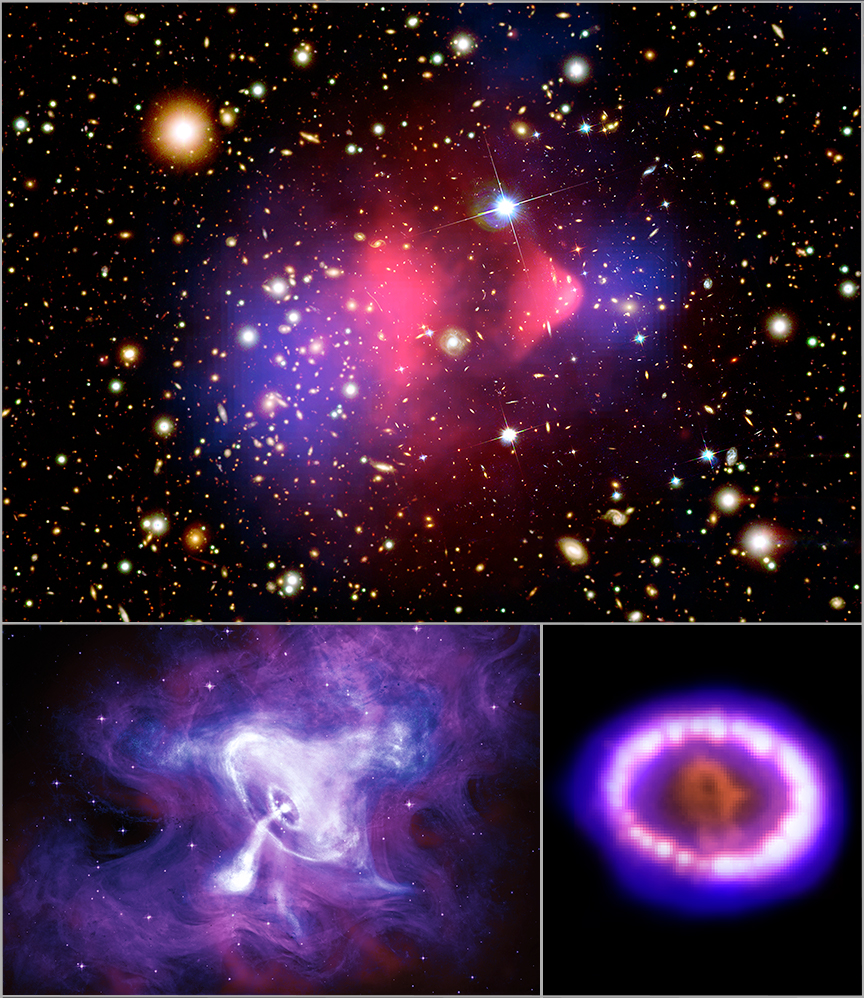
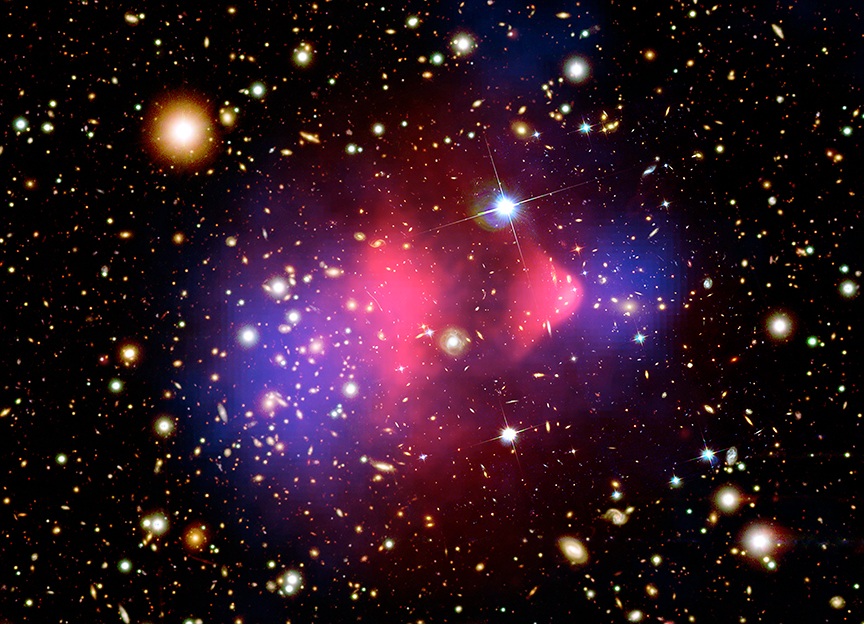
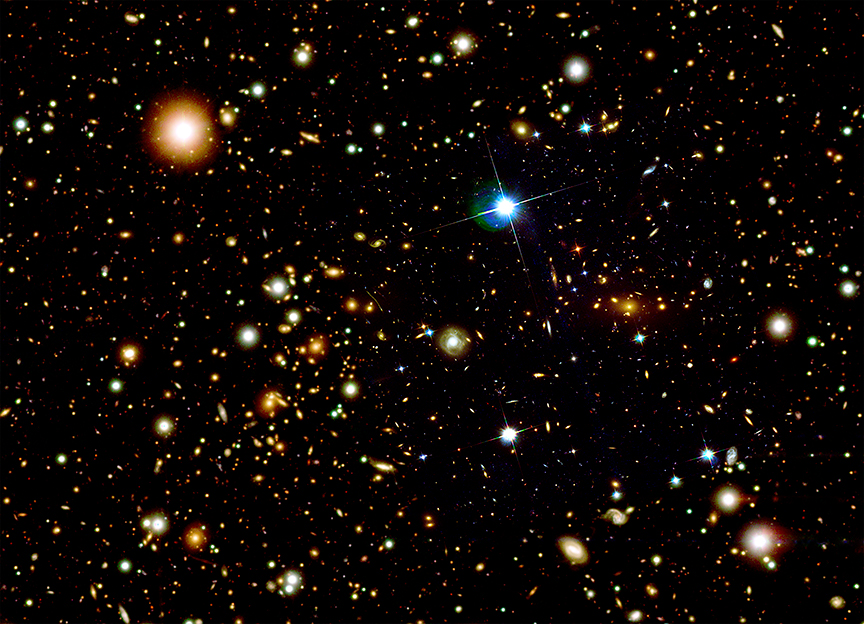
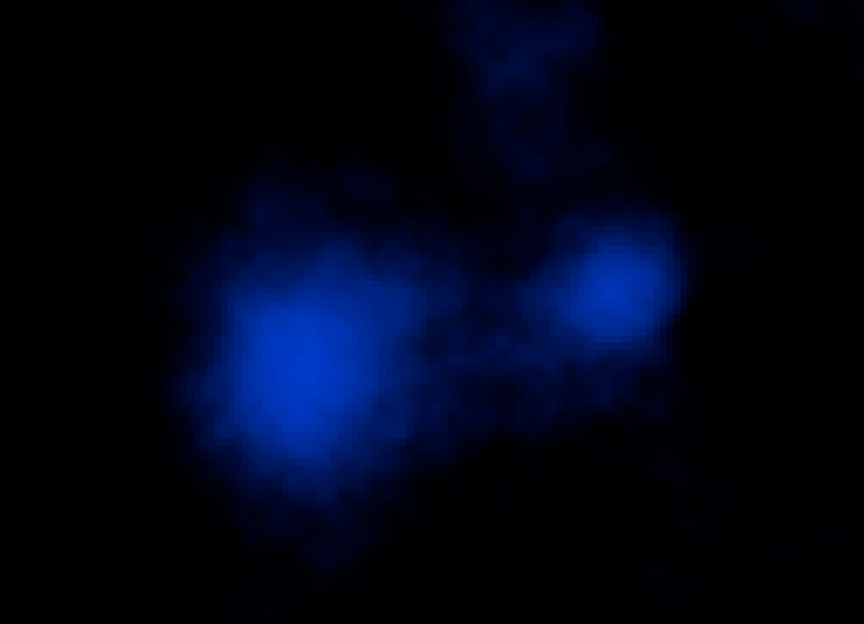
X-ray & Optical Images and Dark Matter Map of the Bullet Cluster
This image of the Bullet Cluster (officially known as 1E 0657-56) provided the first direct proof of dark matter, the mysterious unseen substance that makes up the vast majority of matter in the Universe. X-rays from Chandra (pink) show where the hot gas in two merging galaxy clusters has been wrenched away from dark matter, seen through a process known as "gravitational lensing" in data from Hubble (blue) and ground-based telescopes. In converting this into sound, the data pan left to right, and each layer of data was limited to a specific frequency range. Data showing dark matter are represented by the lowest frequencies, while X-rays are assigned to the highest frequencies. The galaxies in the image revealed by Hubble data, many of which are in the cluster, are in mid-range frequencies. Then, within each layer, the pitch is set to increase from the bottom of the image to the top so that objects towards the top produce higher tones.
Credit: X-ray: NASA/CXC/SAO; Optical: NASA/STScI, Magellan/U.Arizona; Lensing Map: NASA/STScI, ESO WFI, Magellan/U.Arizona
3
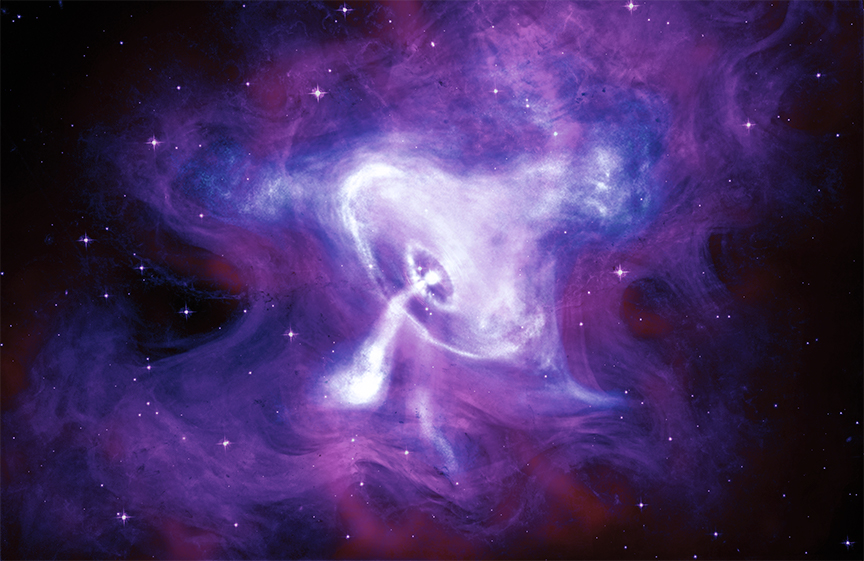
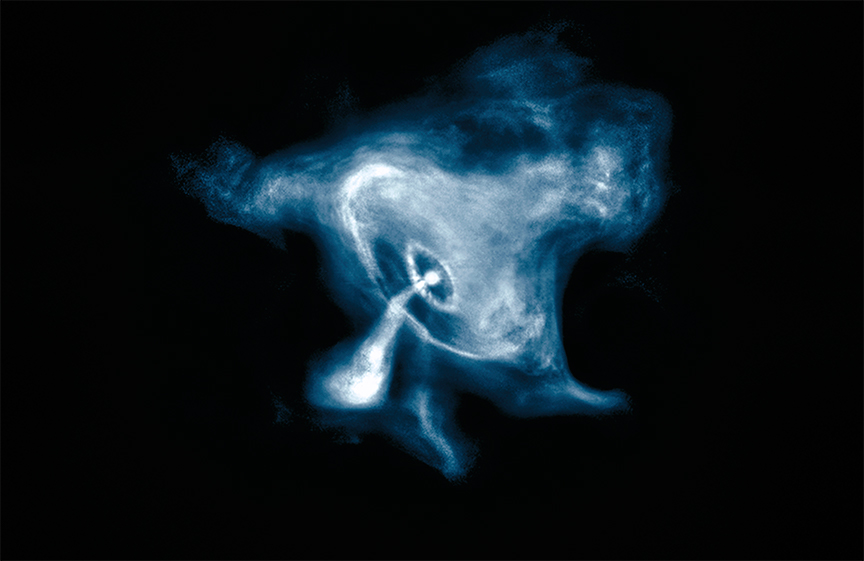
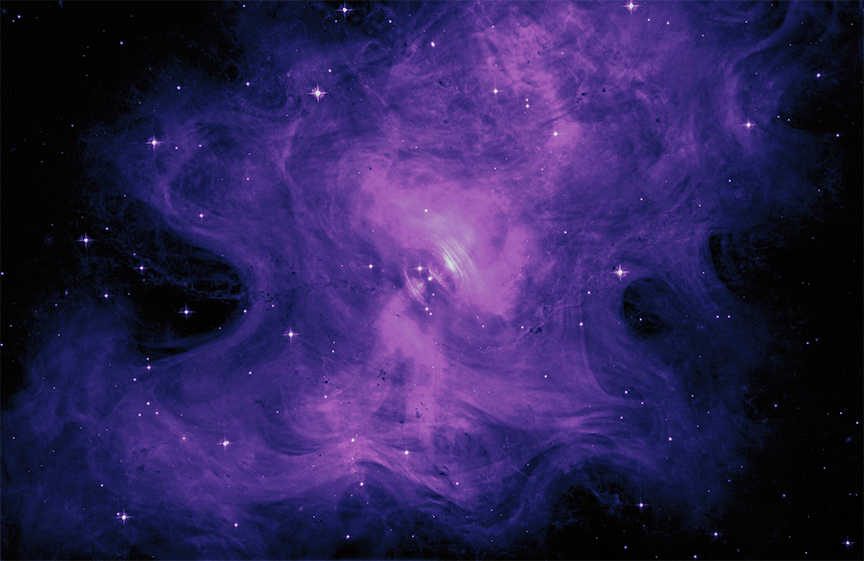
X-ray, Optical, & Infrared Images of the Crab Nebula
The Crab Nebula has been studied by people since it first appeared in Earth's sky in 1054 A.D. Modern telescopes have captured its enduring engine powered by a quickly spinning neutron star that formed when a massive star collapsed. The combination of rapid rotation and a strong magnetic field generates jets of matter and anti-matter flowing away from its poles, and winds outward from its equator. For the translation of these data into sound, which also pans left to right, each wavelength of light has been paired with a different family of instruments. X-rays from Chandra (blue and white) are brass, optical light data from Hubble (purple) are strings, and infrared data from Spitzer (pink) can be heard in the woodwinds. In each case, light received towards the top of the image is played as higher pitched notes and brighter light is played louder.
Credit: X-ray: NASA/CXC/SAO; Optical: NASA/STScI; Infrared: NASA-JPL-Caltech
4
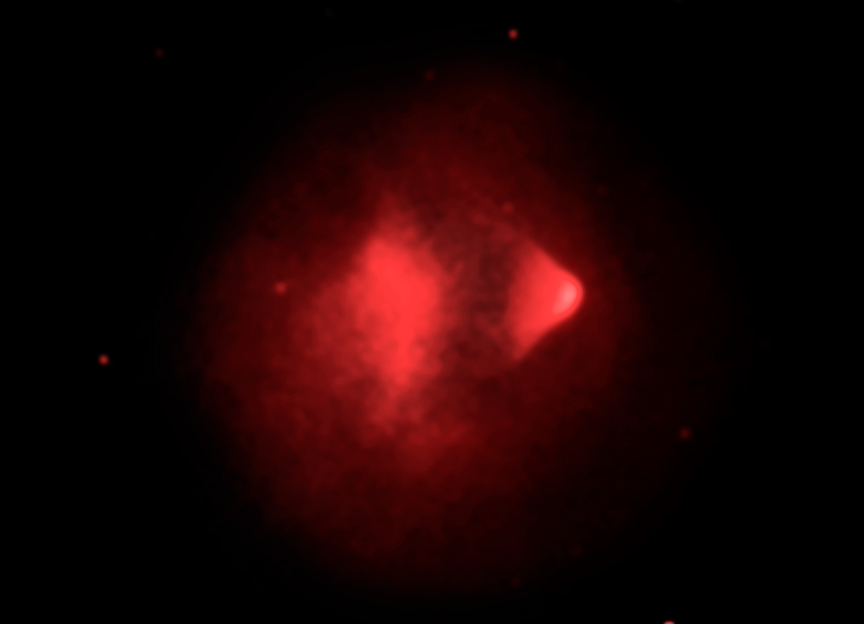
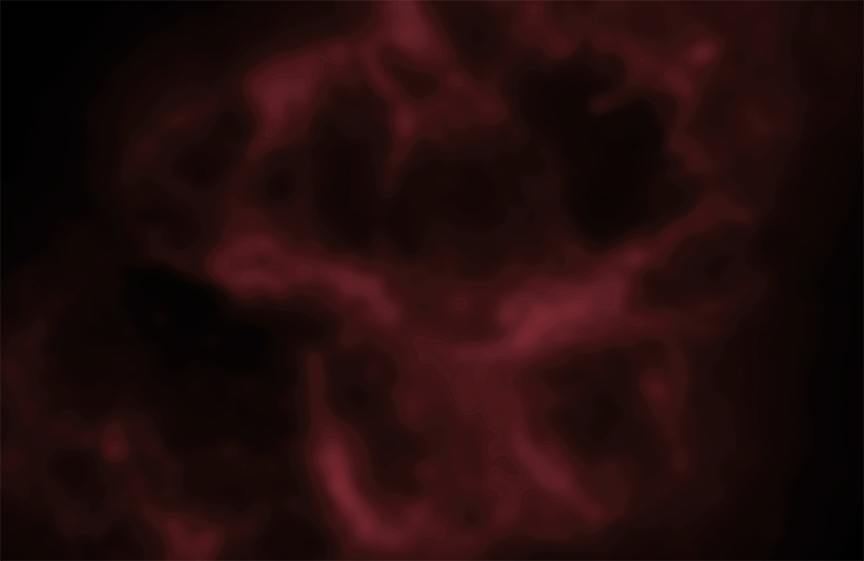
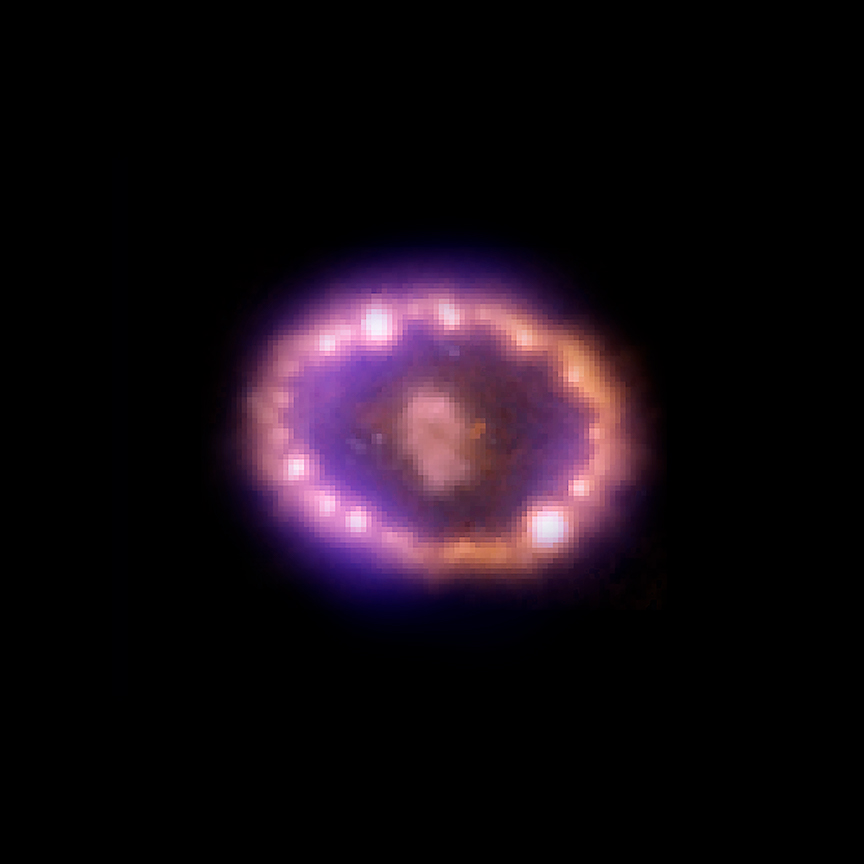
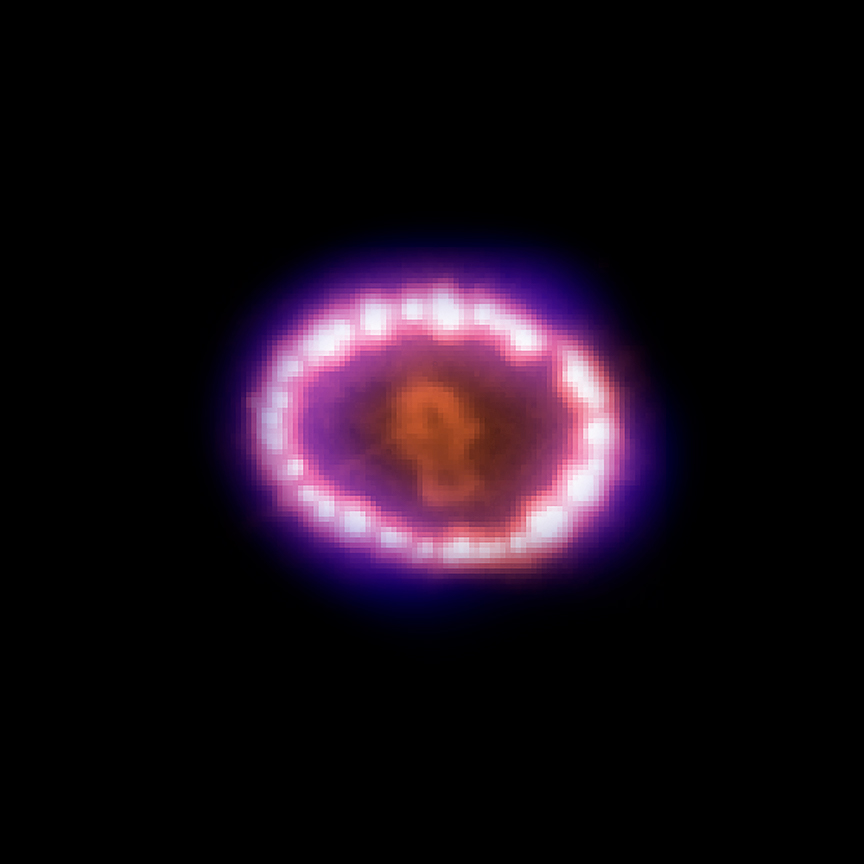
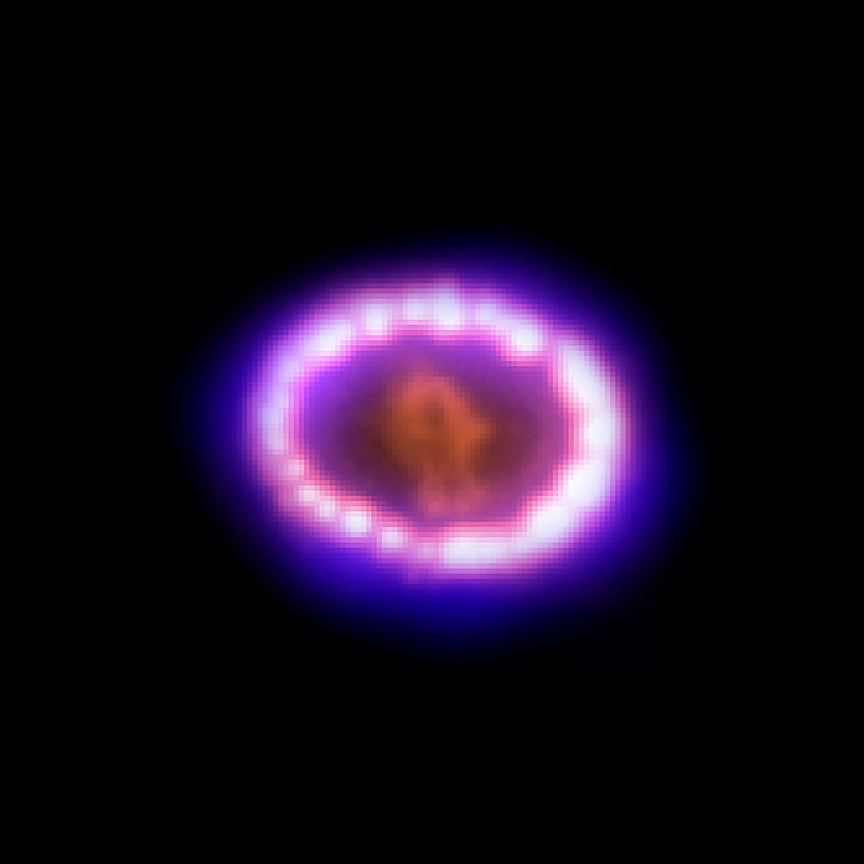
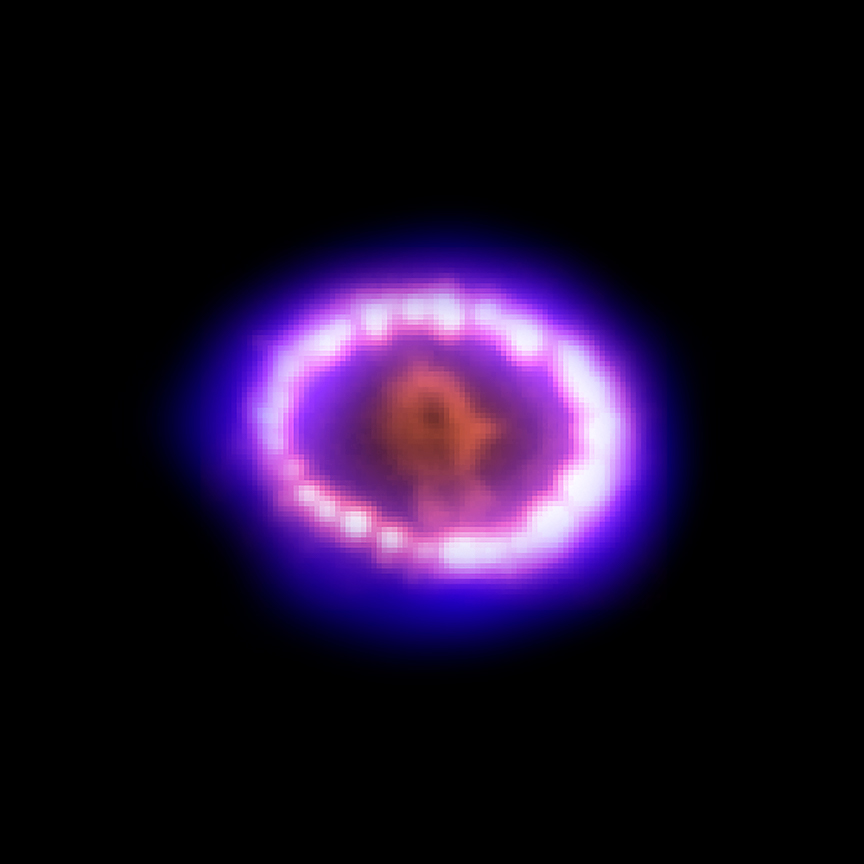
X-ray & Optical Images of Supernova 1987A
On February 24, 1987, observers in the southern hemisphere saw a new object in the Large Magellanic Cloud, a small satellite galaxy to the Milky Way. This was one of the brightest supernova explosions in centuries and soon became known as Supernova 1987A (SN 87A). This time lapse shows a series of Chandra (blue) and Hubble (orange and red) observations taken between 1999 and 2013. This shows a dense ring of gas, which was ejected by the star before it went supernova, begins to glow brighter as the supernova shockwave passes through. As the focus sweeps around the image, the data are converted into the sound of a crystal singing bowl, with brighter light being heard as higher and louder notes. The optical data are converted to a higher range of notes than the X-ray data so both wavelengths of light can be heard simultaneously.
Credit: X-ray: NASA/CXC/SAO; Optical: NASA/STScI
Return to Data Sonification: A New Cosmic Triad of Sound (November 30, 2020)
Revised: November 29, 2022