
CXC Home | Search | Help | Image Use Policy | Latest Images | Privacy | Accessibility | Glossary | Q&A
3-D Visualization of Cassiopeia A
Quicktime MPEG
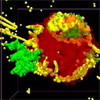
A research team has released a unique look of the supernova remnant Cassiopeia A (Cas A). By combining data from Chandra, the Spitzer Space Telescope, and ground- based optical observations, astronomers have been able to construct the first three-dimensional fly-through of a supernova remnant. This visualization (shown here as a still image) was made possible by importing the data into a medical imaging program that has been adapted for astronomical use. The green region shown in the image is mostly iron observed in X-rays; the yellow region is mostly argon and silicon seen in X-rays, optical and infrared and the red region is cooler debris seen in the infrared. The positions of these points in three-dimensional space were found by using the Doppler effect and simple assumptions about the supernova explosion.
[Runtime: 00:07]
Quicktime MPEG
A research team has released a unique look of the supernova remnant Cassiopeia A (Cas A). By combining data from Chandra, the Spitzer Space Telescope, and ground- based optical observations, astronomers have been able to construct the first three-dimensional fly-through of a supernova remnant. This visualization (shown here as a still image) was made possible by importing the data into a medical imaging program that has been adapted for astronomical use. The green region shown in the image is mostly iron observed in X-rays; the yellow region is mostly argon and silicon seen in X-rays, optical and infrared and the red region is cooler debris seen in the infrared. The positions of these points in three-dimensional space were found by using the Doppler effect and simple assumptions about the supernova explosion.
[Runtime: 00:07]
(Credit: NASA/CXC/MIT/T.Delaney et al.)
3-D Representation of Cassiopeia A
Quicktime MPEG
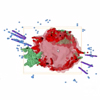
This result shows Cassiopeia A (Cas A) coming alive through the third dimension of space. Utilizing a technique borrowed from medical imaging, astronomers now have a way to travel through the heart of Cas A using data from NASA's Chandra and Spitzer telescopes. The different colors shown here correspond to different elements in the debris from the supernova explosion. This ground-breaking visualization of Cas A was made possible through a collaboration with the Astronomical Medicine project based at Harvard.
[Runtime: 00:36]
Quicktime MPEG
This result shows Cassiopeia A (Cas A) coming alive through the third dimension of space. Utilizing a technique borrowed from medical imaging, astronomers now have a way to travel through the heart of Cas A using data from NASA's Chandra and Spitzer telescopes. The different colors shown here correspond to different elements in the debris from the supernova explosion. This ground-breaking visualization of Cas A was made possible through a collaboration with the Astronomical Medicine project based at Harvard.
[Runtime: 00:36]
(Credit: NASA/CXC/MIT/T.Delaney et al.)
3-D Fly-Through of Cassiopeia A
Quicktime MPEG
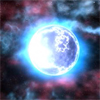
This visualization shows a fly-through of Cas A based on the 3-D representation constructed from Chandra and Spitzer data. It begins with an artists rendition of the neutron star previously detected by Chandra. Next, new features unseen in traditional 2-D data sets are visible, including details of how the parent star exploded. The green region is mostly iron observed in X-rays; the yellow region is mostly argon and silicon seen in X-rays, optical and infrared; the red region is cooler debris seen in the infrared and the blue region is the outer blast wave, most prominent in X-rays.
[Runtime: 00:53]
Quicktime MPEG
This visualization shows a fly-through of Cas A based on the 3-D representation constructed from Chandra and Spitzer data. It begins with an artists rendition of the neutron star previously detected by Chandra. Next, new features unseen in traditional 2-D data sets are visible, including details of how the parent star exploded. The green region is mostly iron observed in X-rays; the yellow region is mostly argon and silicon seen in X-rays, optical and infrared; the red region is cooler debris seen in the infrared and the blue region is the outer blast wave, most prominent in X-rays.
[Runtime: 00:53]
(Credit: Visualization: NASA/CXC/D.Berry; Model: NASA/CXC/MIT/T.Delaney et al.)
Animation of a Supernova Explosion
Quicktime MPEG
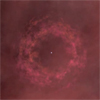
This artist's animation shows the basics of a supernova explosion like the one that created Cas A. When a massive star runs out of fuel, it collapses onto itself and its remains are then expelled into the surrounding space. This expanding debris field is very hot and thus glows brightly in X-rays, which are detected by telescopes like Chandra. At the end of the animation, the view dissolves into an image of Cas A created from Chandra data.
[Runtime: 00:26]
Quicktime MPEG
This artist's animation shows the basics of a supernova explosion like the one that created Cas A. When a massive star runs out of fuel, it collapses onto itself and its remains are then expelled into the surrounding space. This expanding debris field is very hot and thus glows brightly in X-rays, which are detected by telescopes like Chandra. At the end of the animation, the view dissolves into an image of Cas A created from Chandra data.
[Runtime: 00:26]
(Credit: NASA/CXC/A.Hobart)
Return to Cassiopeia A (January 6, 2009)
Revised: October 24, 2025