
CXC Home | Search | Help | Image Use Policy | Latest Images | Privacy | Accessibility | Glossary | Q&A
The Hertzsprung-Russell (H-R) Diagram
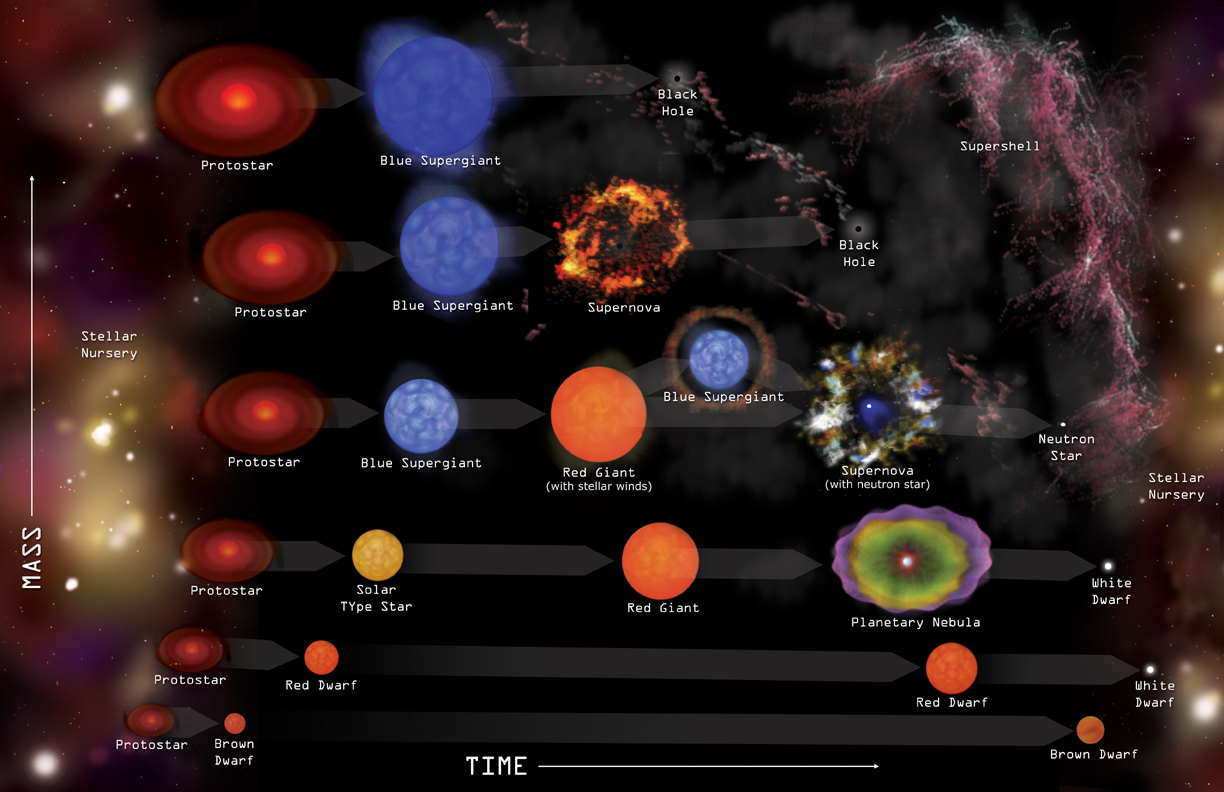
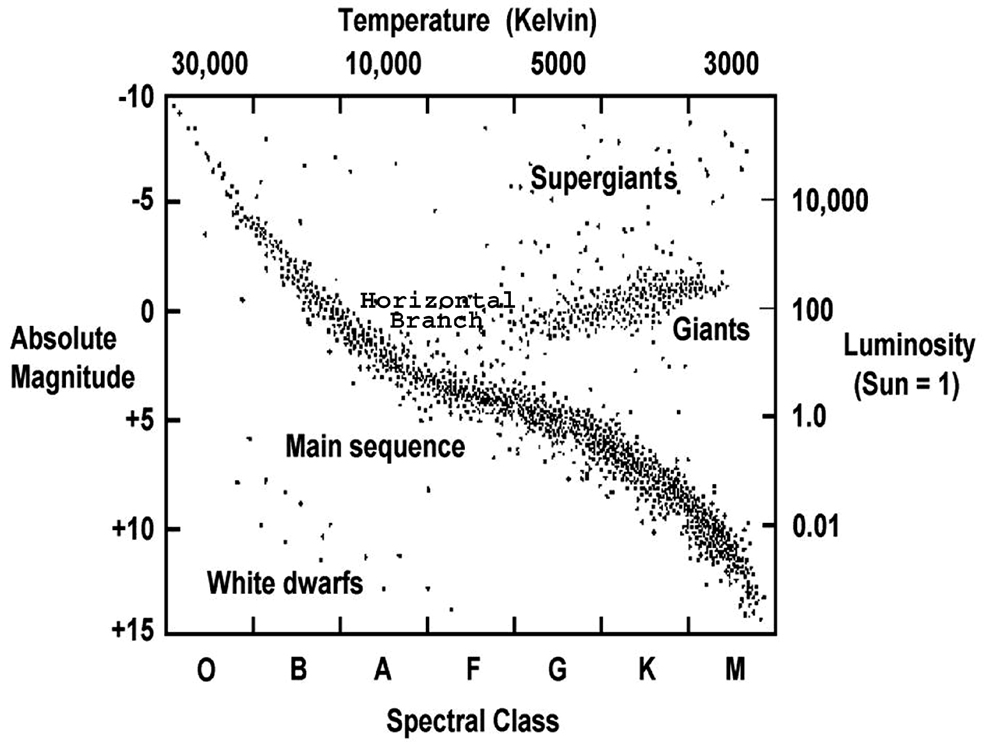
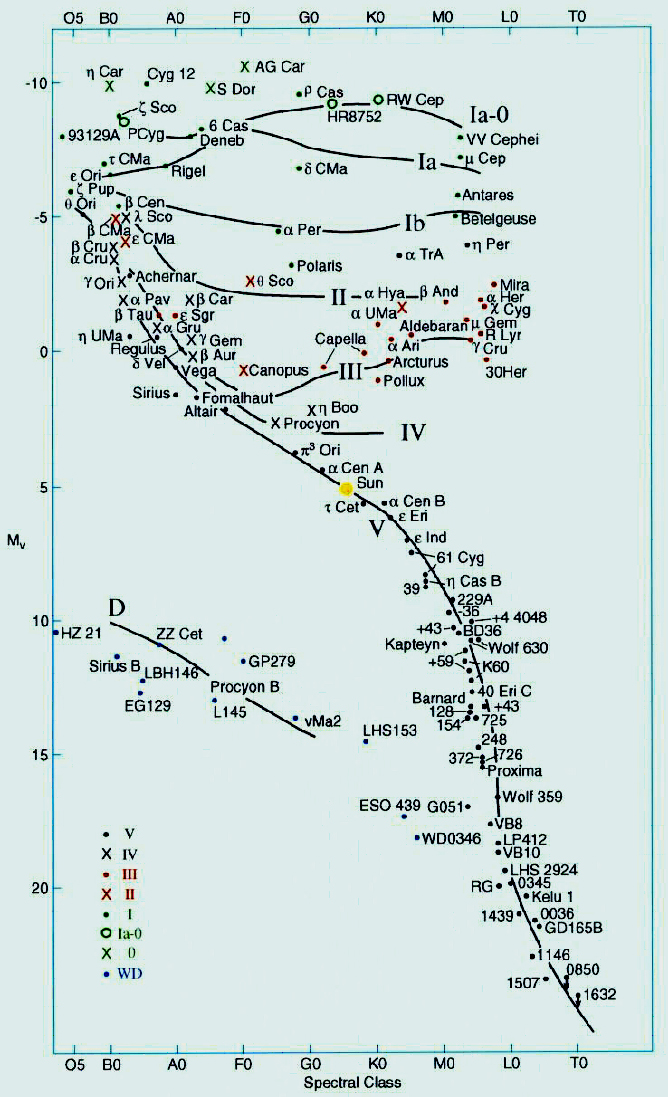
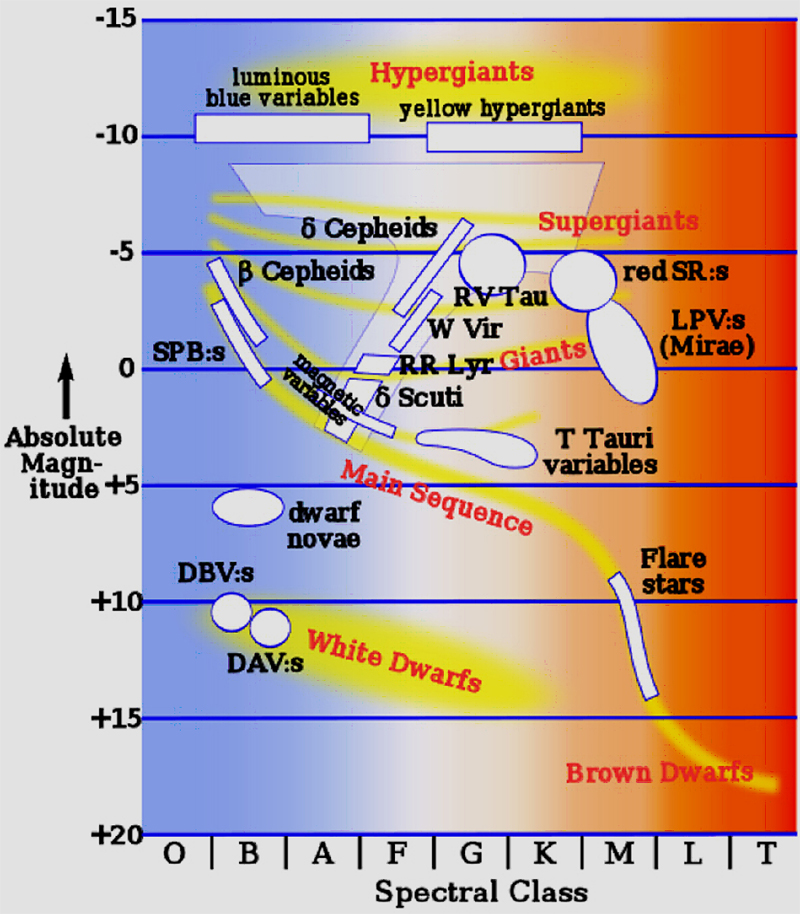
In the early 1900’s Ejnar Hertzsprung and Henry Norris Russell developed the Hertzsprung - Russell diagram (H-R diagram) – an important astronomical tool that represented a major step towards understanding how stars evolve over time. Stellar evolution can not be studied by observing individual stars as most changes occur over several millions and billions of years. Astrophysicists observe numerous stars at various stages in their evolutionary history to determine their changing properties and probable evolutionary tracks across the H-R diagram. The H-R diagram is a scatter graph of stars – a plot of stellar absolute magnitude or luminosity versus surface temperature or stellar classification. Stages of stellar evolution occupy specific regions on the H-R diagram and exhibit similar properties. One class of stars – the pulsating variables which include Cepheids, RR Lyraes, Semiregulars and Miras – occupy regions of instability on the H-R diagram and represent transitional periods between stages of evolution.
The H-R Diagram
The Periodic Table of the Elements
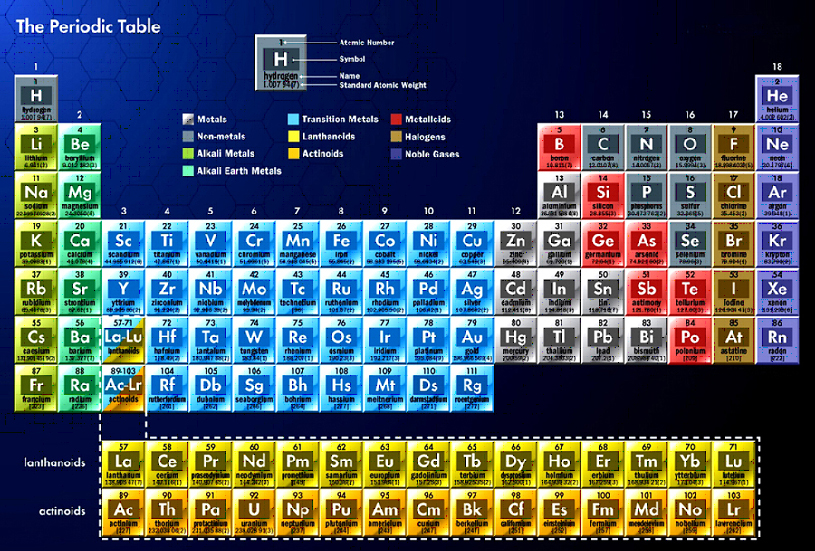
The Hertzsprung-Russell (H-R) diagram is an analog to the periodic table of the elements. It was discovered that when the absolute magnitude (MV) – intrinsic brightness – of stars is plotted against their surface temperature (stellar classification) the stars are not randomly distributed on the graph but are mostly restricted to a few well-defined regions. The stars within the same regions share a common set of characteristics, just like the groups, periods, and blocks of elements in the periodic table. Unlike the periodic table, as the physical characteristics of a star change over its evolutionary history, its position on the H-R diagram changes also – so the H-R diagram can also be thought of as a graphical plot of stellar evolution. From the location of a star on the diagram, its luminosity, spectral type, color, temperature, mass, age, chemical composition and evolutionary history is known.
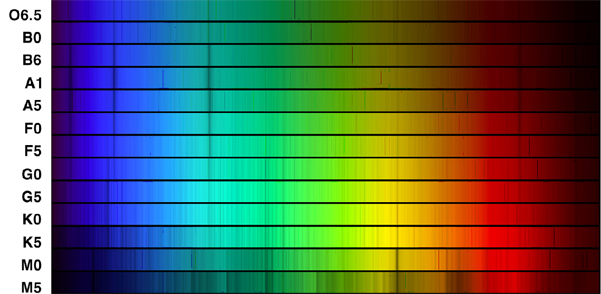
Harvard Classification System Spectral Images
Most stars are classified by temperature (spectral type) from hottest to coolest as follows: O B A F G K M. These categories are further subdivided into subclasses from hottest (0) to coolest (9). The hottest B stars are B0 and the coolest are B9, followed by spectral type A0. Each major spectral classification is characterized by its own unique spectra. Though O B A F G K and M are the stellar classifications commonly shown on H-R diagrams, a number of new and extended spectral classes have been designated. These include Wolf-Rayet stars (W), cool dwarfs (L), brown dwarfs (T), carbon stars (C), and stars with zirconium oxide lines that are between M and C stars (S). The carbon stars (C) include stars that were originally classified as R and N stars. Class D (degenerate) is the modern classification for white dwarfs. The major classifications have subclasses – Class D is divided into 7 different subtypes of white dwarfs based upon variations in the composition of their atmospheres, e.g. DQ white dwarfs have a carbon-rich atmosphere as indicated by atomic or molecular carbon spectral lines.
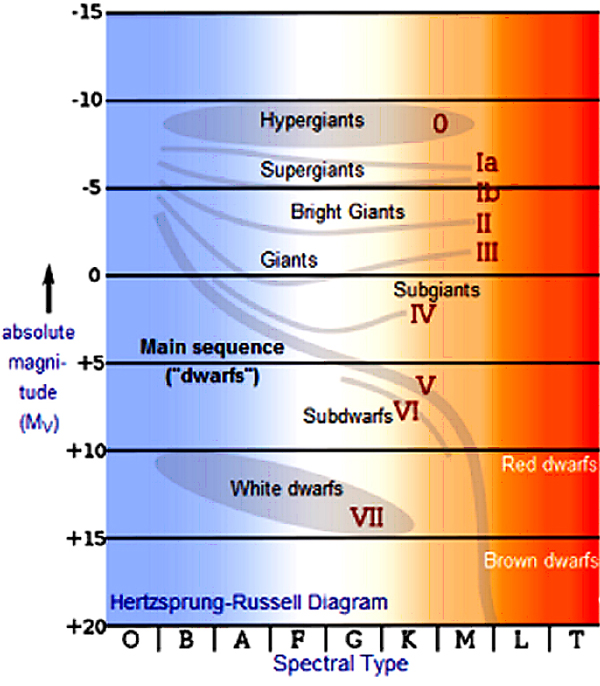
Spectral lines can show different characteristics within the same spectral type or temperature (T), and so a second type of classification system for stars was devised using luminosity. The differences in spectral lines among stars having the same spectral type are a function of the radius of the star, which results in different luminosities. Luminosity (L) is related to the absolute magnitude (MV) of a star, and is the total amount of energy radiated per second. Luminosity is proportional to the fourth power of the temperature (T4). Two stars with similar effective temperatures but greatly different luminosities must therefore differ in size. They belong to different luminosity classes within that spectral type, as determined from their spectra. Stellar luminosities range from one million times more luminous than the Sun to one ten-thousandth of the luminosity of the Sun. The basic luminosity categories from most to least luminous are I and II, supergiants and bright giants respectively, III giants, IV subgiants, V main sequence stars, VI subdwarfs and VII white dwarfs.
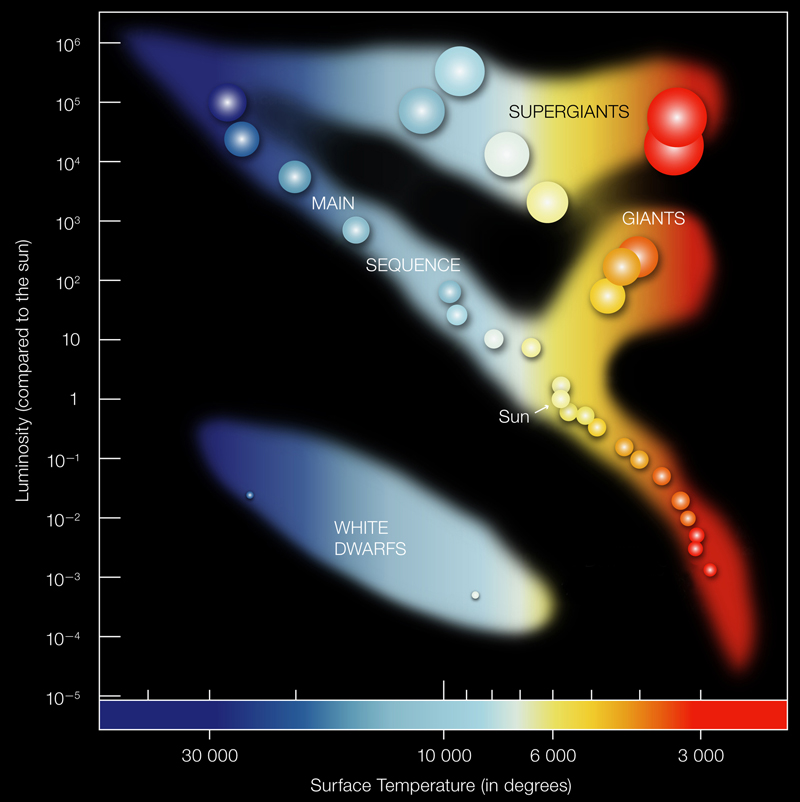
Major Branches on the H-R Diagram
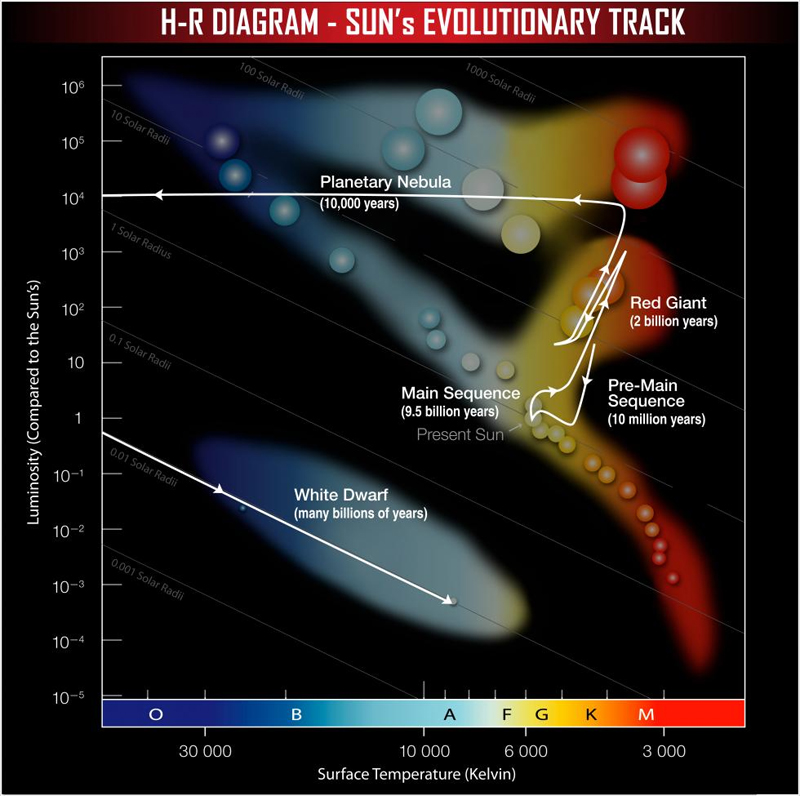
Evolutionary Track of the Sun
Across the H-R Diagram
Starting at the upper left-hand corner and curving down to the lower right-hand corner is a band called the main sequence. ~90% of all stars lie within the main sequence. These stars run from the hot and bright O and B stars at the top left-hand corner to the cool, dim K and M stars at the lower right-hand corner. Main sequence stars have a fairly steady rate of hydrogen fusion ongoing in their cores. In main sequence stars, the radiation pressure pushing outward from the fusion process balanced by the inward pull of gravitational forces maintains a state of dynamic equilibrium. When hydrogen in the core is depleted and radiation pressure decreases, the two forces become unbalanced and the star “moves off the main sequence” and begins a series of evolutionary stages – the final end product(s) depending upon the initial mass of the star. The giant and supergiant branches of the H-R diagram are occupied by stars that have transitioned from the main sequence and are fusing heavier atomic nuclei. As most stars transition from the main sequence to the giant and supergiant branches, they exhibit different types of variability that are also confined to specific regions on the diagram.
Variable Stars and Light Curves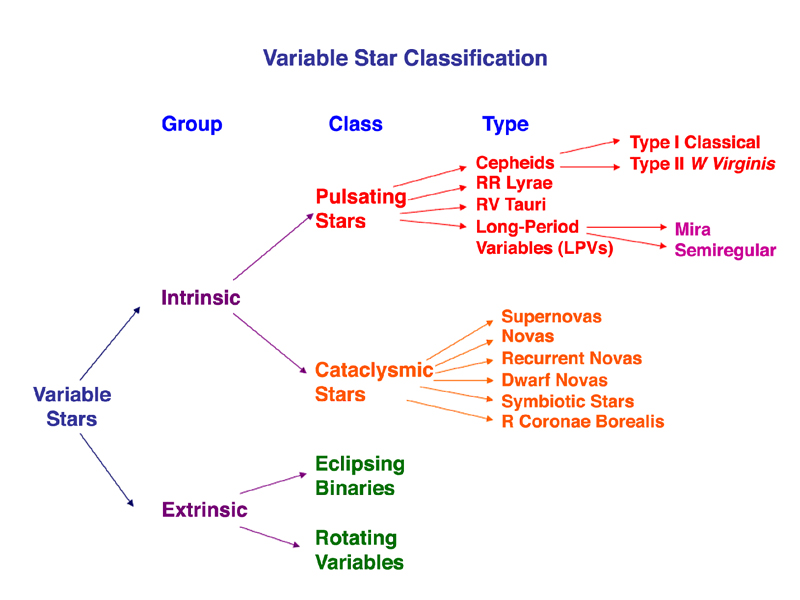
A Variable Star Classification
As many stars transition from one stage to another on the H-R diagram they vary in brightness. The brightness that a star appears to have (apparent magnitude) from our perspective here on Earth depends upon its distance from Earth and its actual intrinsic brightness, or absolute magnitude (MV). The behavior of stars that vary in magnitude (brightness) can be studied by measuring their changes in brightness over time and plotting the changes on a graph called a light curve. Light curves are usually plots of apparent magnitude over time. The apparent magnitudes of stars are adjusted to what their values would be without the light extinctions caused by the atmosphere. The brightest stars are designated as first magnitude, and those at the limits of unaided eye observation as sixth magnitude. Vega, the brightest star in the summer sky in the Northern Hemisphere, was originally designated as the zero point, and has an apparent magnitude of +0.03. Examples of apparent magnitude values for celestial objects are: the Sun as seen from Earth -26.74, the full moon -12.92, Crab supernova (SN 1054) -6.00, Venus -4.89, Sirius (α Canis Majoris) -1.47 M33, (Andromeda Galaxy) +5.72, and Pluto +13.65.
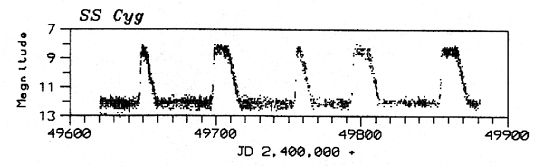
Historically the time scale has been the Julian Day (JD), a counting system starting with January 1, 4713 BC – Julian Day number 1. Currently astronomers are beginning to use day and/or year for the time scale. Measuring and recording the changes in magnitude and plotting the resulting light curves allow astronomers to determine the period of variation. The period is the amount of time it takes for the star to go through one complete cycle from maximum magnitude through minimum magnitude and back to maximum magnitude. The 2011 General Catalog of Variable Stars (GCVS) classifies 43,675 Milky Way Galaxy stars into several different categories and subcategories of variability. NOTE: For more information about variable stars and light curves, The American Association of Variable Star Observers (AAVSO) has a set of curricular materials – Variable Star Astronomy (VSA) – with content, activities and investigations, based on the AAVSO’s unique electronic database of more than 21,000,000 variable star observations. The VSA materials are available at http://www.aavso.org/education/vsa
Intrinsic Variable Stars – Cataclysmic and PulsatingIntrinsic variable stars vary due to physical changes within the star or star system and are divided into two classes – cataclysmic and pulsating. Many of these variables are either stages of stellar evolution, or transitional periods from one stage of stellar evolution to another. Pulsating stars are important for studying the internal structures and processes of evolving stars.
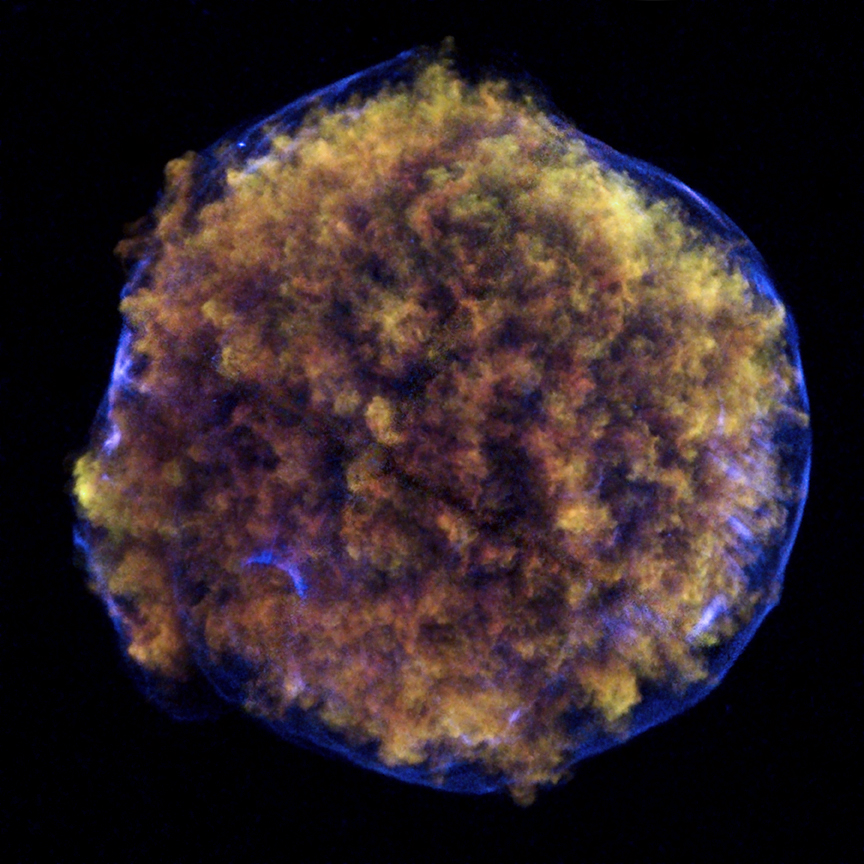
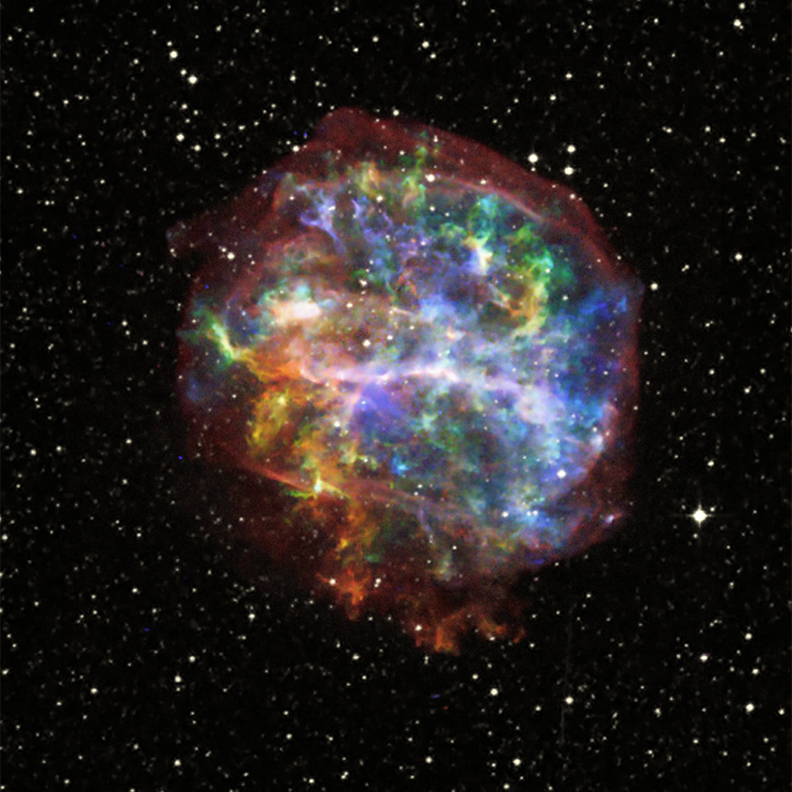
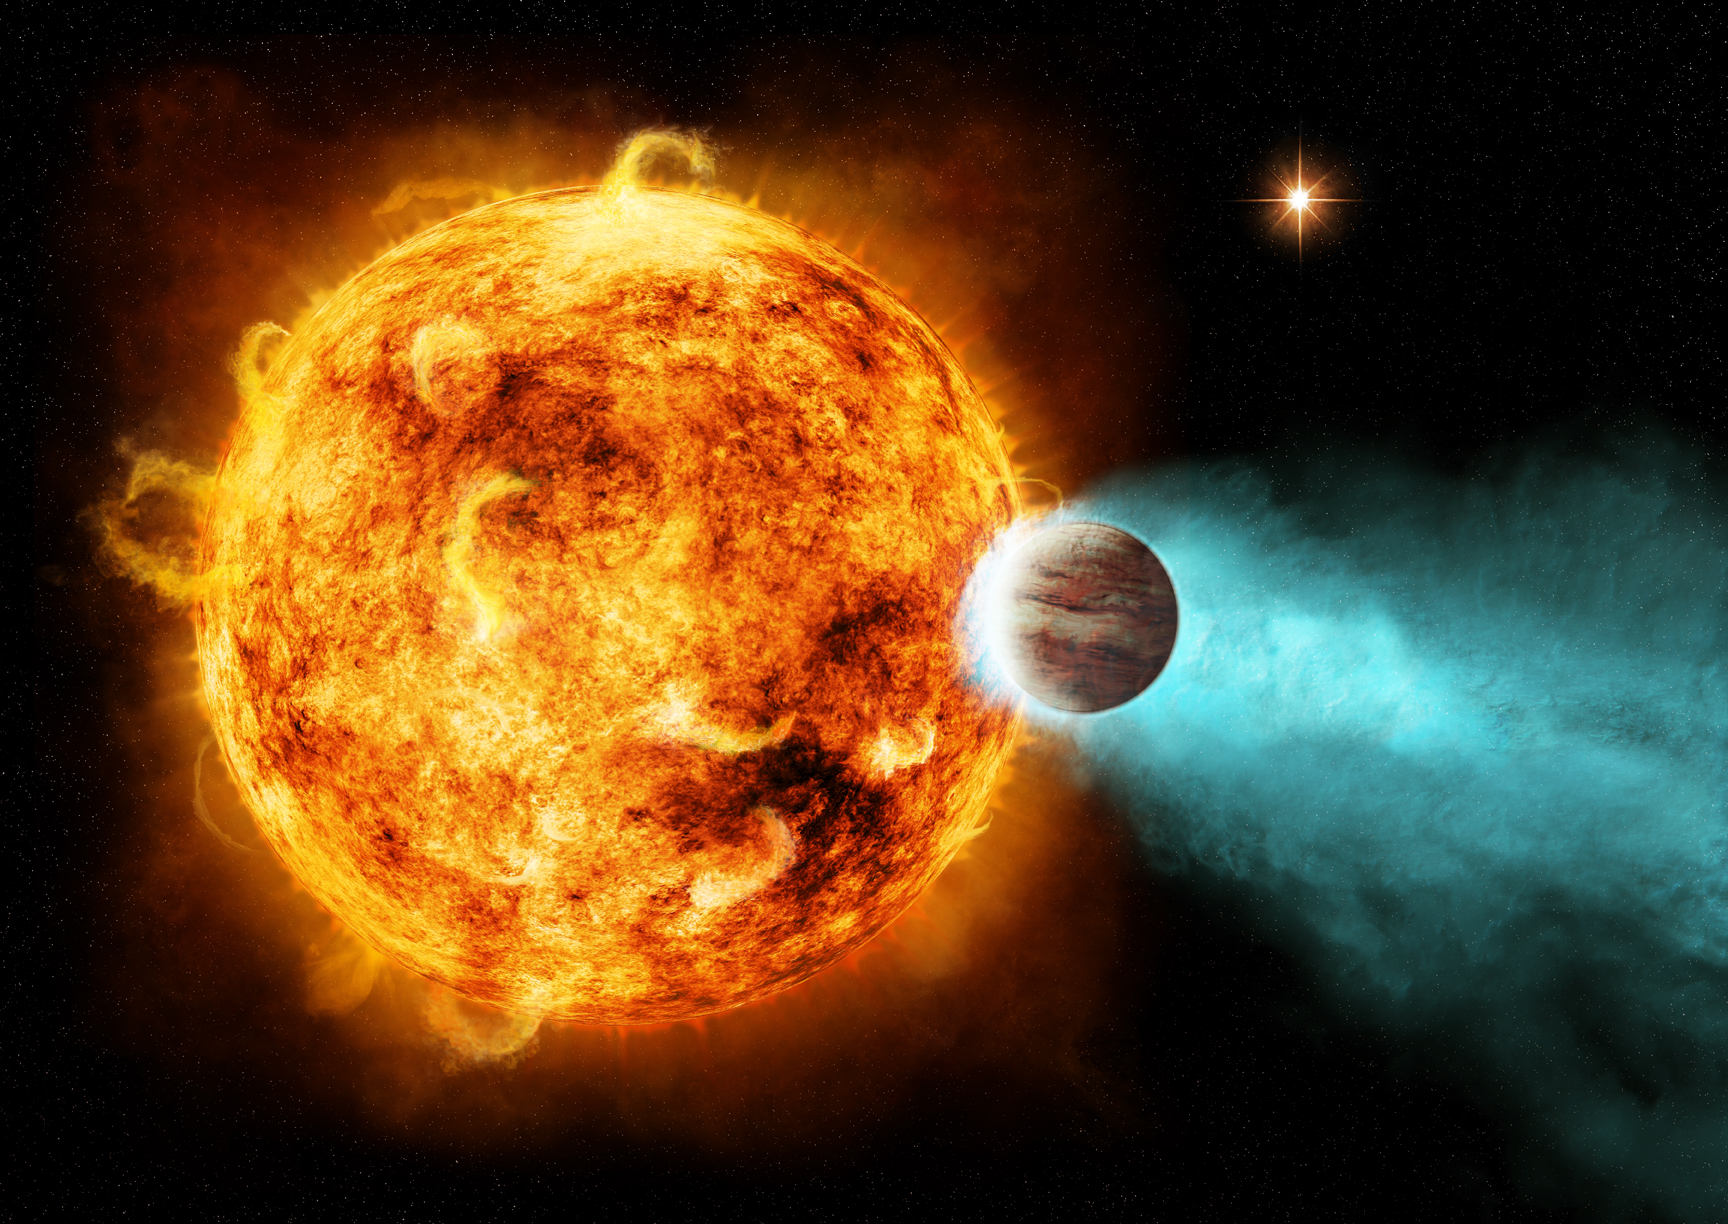
Cataclysmic Variables: Supernovas and novas are cataclysmic variables. Nova eruptions occur in contact binary systems. Some systems consist of a white dwarf orbiting a larger and cooler star, such as a red giant – others have a white dwarf and a main sequence star companion. A layer of hydrogen-rich material is slowly accreted from the red giant or main sequence star into an accretion disk surrounding the compact white dwarf. As matter accumulates in the accretion disk, the disk becomes unstable. Eventually, matter from the unstable disk may fall onto the white dwarf, leading to an outburst, or nova. If the amount of material infalling onto the surface of the white dwarf is large enough for the mass of the white dwarf to approach the Chandrasekhar limit, runaway fusion results in a thermonuclear explosion which completely destroys the white dwarf – leaving behind only the remnant. The system increases in brightness to a typical magnitude of -19.3 within a few days, then the light slowly fades back to its original brightness over the next several months to years. The thermonuclear destruction of a white dwarf is a Type Ia supernova event. The discovery for the first recognized variable star is attributed to Tycho Brahe, who discovered a supernova in 1572. Tycho's supernova was a Type Ia event – a remnant with no stellar core.
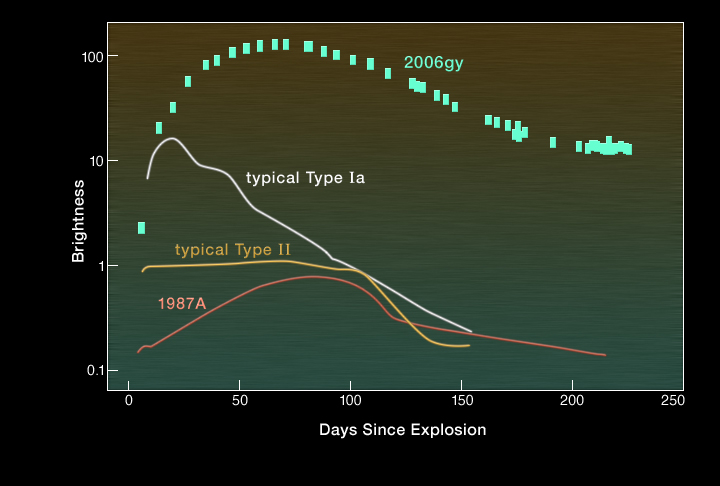
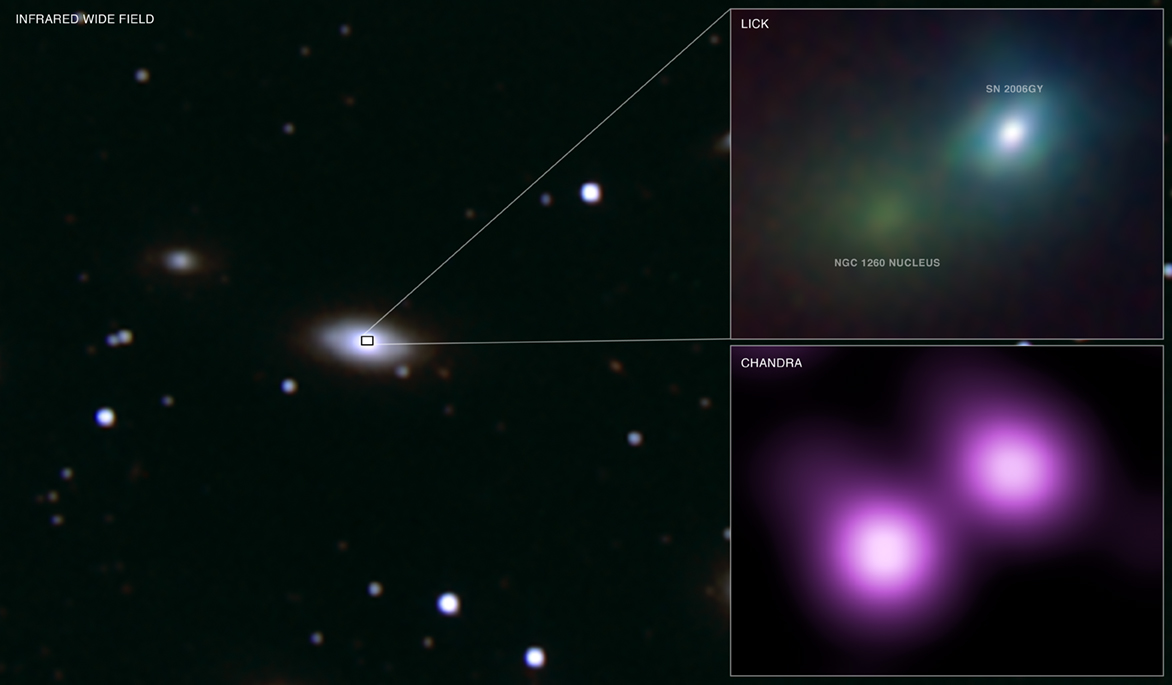
Comparison Light Curves for Type Ia, Type II,
SN 1987 (Type II), and SN 2006gy Supernovas
A Type II supernova is the result of the core collapse of a massive star. The core collapses so fast that it momentarily goes past its equilibrium point at nuclear density and instantaneously rebounds. The innermost layers of the star are still in-falling and meet the rebounding core, creating a shock wave that runs outward through the layers towards to the star's surface. A Type II supernova can brighten by 20 magnitudes or more; and if the progenitor star is truly massive, it can outshine the entire galaxy in X-ray emissions. The end product within the remnant depends upon the initial mass of the star, and is a neutron star, pulsar, magnetar, or black hole. Supernovas are the catastrophic and final evolutionary stages for more massive stars (Type II) and mid-sized progenitor stars in a contact binary system that had evolved into a planetary nebula and white dwarf (Type Ia). More information about Type Ia and Type II supernovas is available at: http://chandra.harvard.edu/edu/formal/snr/bg.html.
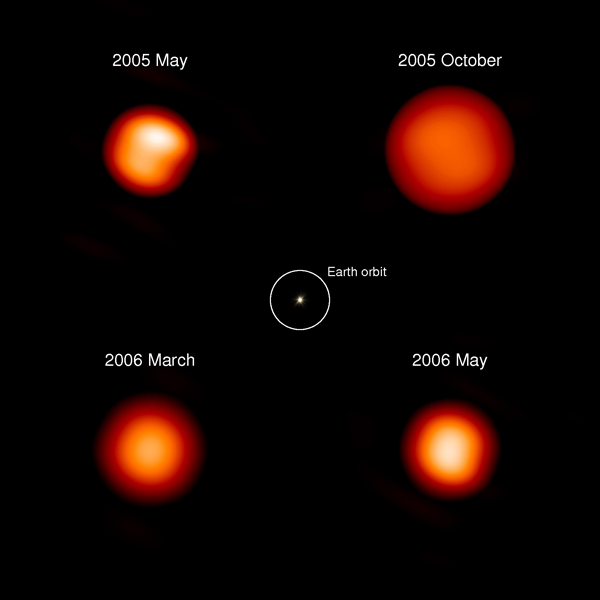
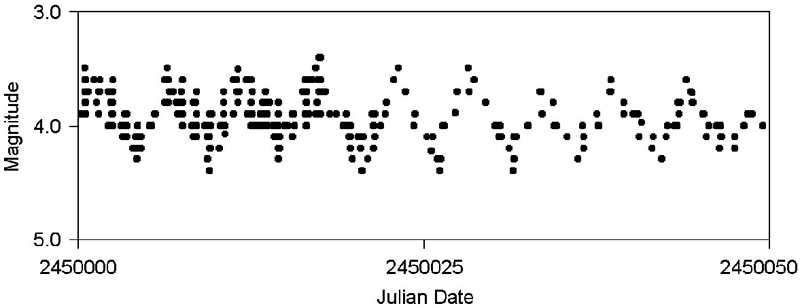
A Pulsating Mira Variable Star (Chi Cyg)
Pulsating Variables: Pulsating variable stars vary in brightness due to physical changes within the interior of the star. The pulsations are due to the periodic expansion and contraction of the surface layers of the stars. The change in size is observed as a change in apparent magnitude. Stars pulsate because they are not in hydrostatic equilibrium: the force of gravity acting on the outer mass of the star is not balanced by the interior radiation pressure directed outwards from the interior. If a star expands as a result of increased radiation pressure, the material density and pressure decrease until hydrostatic equilibrium is reached and then overshot, owing to the momentum of the expansion. At this point the star is transparent and photons can escape. Then gravity dominates, and the star begins to contract. The momentum of the infalling material carries the contraction beyond the equilibrium point. The star becomes opaque and photons are trapped and the star becomes dimmer. The pressure again becomes too high, and the cycle starts over again. The system acts as an oscillator. With loose atmospheric layers of gases, the oscillations get out of phase with one another and set the stage for chaotic motions. Energy is dissipated during such pulsations (analogous to losses caused by friction forces), and eventually this loss of energy should result in a damping or lessening of the pulsations. The prevalence and regularity of pulsating stars imply that the dissipated energy is replenished in some way. The dynamics of pulsating variable stars is complicated and not well understood.
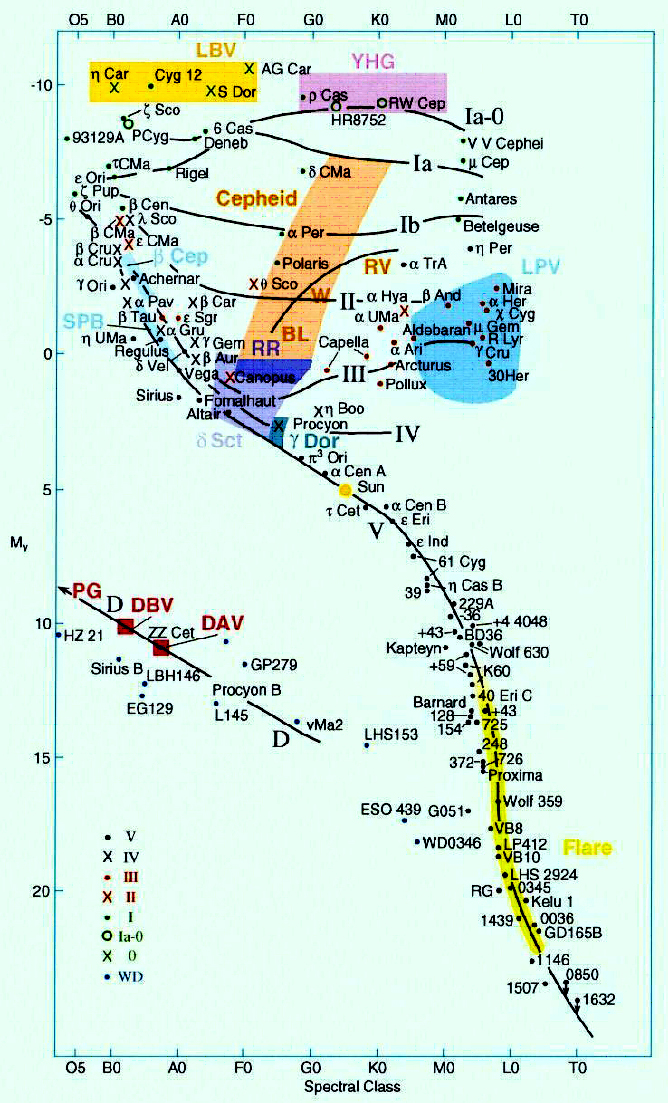
The different types of pulsating variables are distinguished by their periods of pulsation and the shapes of their light curves. These in turn are a function of their mass and evolutionary stage. Cepheids, RR Lyraes, and Long Period Variables (LPVs) – Miras and Semiregulars – are pulsating variable stars and occupy regions on the H-R diagram called instability strips. The instability occurs as main sequence stars transition to and along the giant and supergiant branches of the H-R diagram.
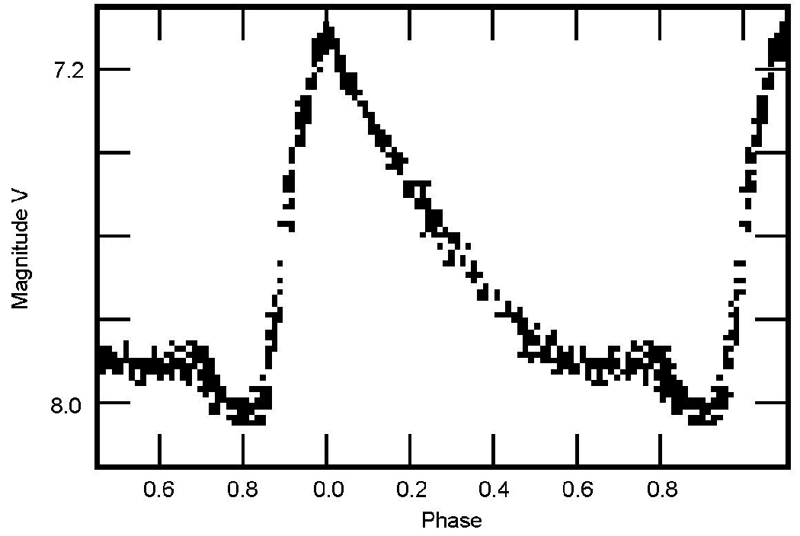
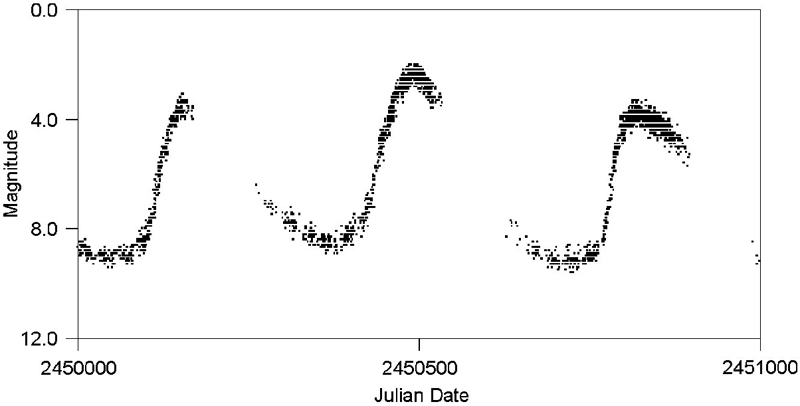
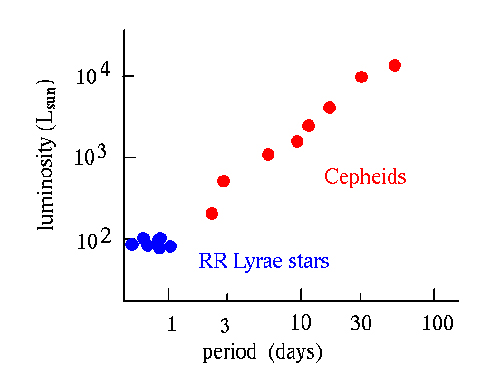
Cepheid variable stars expand and contract in a repeating cycle of size changes. The change in size can be observed as a change in apparent brightness (apparent magnitude.) Cepheids have a repeating cycle of change that is periodic - as regular as the beating of a heart, with periods of 1 to 70 days with an amplitude variation of 0.1 to 2.0 magnitudes. These massive stars (~8 solar masses) have a high luminosity and are spectral class F at maximum, and G to K at minimum. Cepheids occupy an elongated horizontal instability strip on the H-R diagram as massive stars transition from the main sequence to the giant and/or supergiant branches.
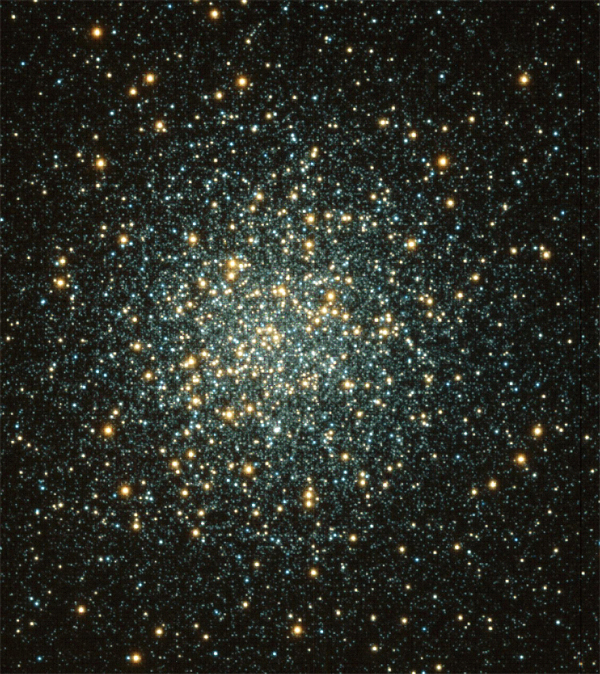
RR Lyrae variables are older pulsating white giants with low metallicity. They are common in globular clusters – dense groups of old stars in the halos of galaxies. Like Cepheids, their pulsations are periodic. RR Lyraes have ~0.5 solar mass and have a short pulsation period of 0.05 to 1.2 days and amplitude variations of 0.3 to 2 magnitudes. RR Lyrae stars are usually spectral class A. RR Lyrae stars occupy a small instability strip near the intersection of the main sequence and the horizontal giant branch (HB). The HB stars have left the red giant branch and are characterized by helium fusion in their cores surrounded by a shell of hydrogen fusion. RR Lyrae stars are highly evolved older stars with low metallicity, more luminous than the Sun and less luminous than Cepheids. Globular clusters with well-defined horizontal branches usually have significant numbers of RR Lyrae stars.
All of the RR Lyrae stars in a cluster have the same average apparent magnitude. In different clusters, the average apparent magnitude is different. This is because all RR Lyraes have about the same average absolute magnitude of +0.75. Many lower-mass giant stars will go through a RR Lyrae pulsation stage while many higher-mass giant stars will go through a Cepheid stage. Because low-mass stars live longer than high-mass stars, the Cepheid stars as a group are younger than the RR Lyrae stars. RR Lyrae stars can be used as standard candles to measure cosmological distances out to ~760,000 parsecs (2.5 million light years). The more luminous Cepheid variables can be used to measure distances out to ~40 million parsecs (130 million light years).
The Period-Luminosity Relationship
Cepheids and RR Lyrae variables portray a relationship between their periods and luminosities. The period-luminosity relationship is also known as the Leavitt law –named after its discoverer Henrietta Leavitt at the Harvard College Observatory in Cambridge, Massachusetts in the early 1900’s. Once a Cepheid or RR Lyrae has been identified from its light curve, the period is calculated and the associated luminosity is determined. The luminosity is then either used directly or converted to absolute magnitude and used with the apparent magnitude in the distance modulus equation to calculate distances. The distance modulus is a mathematical relationship that relates absolute magnitude, apparent magnitude, and distance. The general relationship is written as: m - M = 5 log10 [d / (10 pc)], where m = apparent magnitude, M = absolute magnitude and d = distance.
Long Period Variables (LPVs) are pulsating red giants or supergiants with periods ranging from 30-1000 days. They are usually of spectral type M, R, C or N. There are two subclasses; Mira and Semiregular.
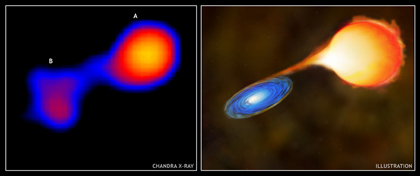
Mira variables are periodic pulsating red giants with periods of 80 to 1000 days. It is a stage that most mid-sized main sequence stars transition through as they evolve to the red giant branch. Miras have amplitude variations of more than 2.5 magnitudes. Mira (Omicron Ceti) is the prototype of Mira variable stars. The Sun will eventually transition through a pulsating Mira stage. The Mira instability strip on the H-R diagram is located in a region between mid-sized stars on the main sequence and the giant branch. Mira was the second variable star to be discovered, by David Fabricius in 1596 – 24 years after Tycho’s observation of a Type Ia supernova. Mira is in a contact binary system with a white dwarf companion. Material from the surface of the red giant Mira A is forming an accretion disk surrounding the white dwarf – Mira B. Mira will eventually collapse and form a planetary nebula and a white dwarf. If a large enough mass of materials infalls onto the surface of the white dwarf (Mira B) from Mira A, the white dwarf could produce a Type Ia supernova event – otherwise the system will result in two co-orbiting white dwarfs.
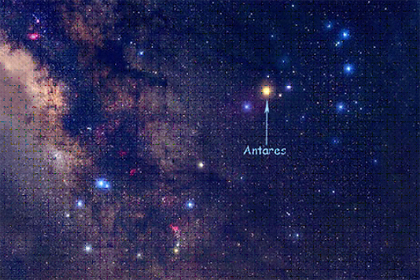 Antares in the Constellation Scorpio |
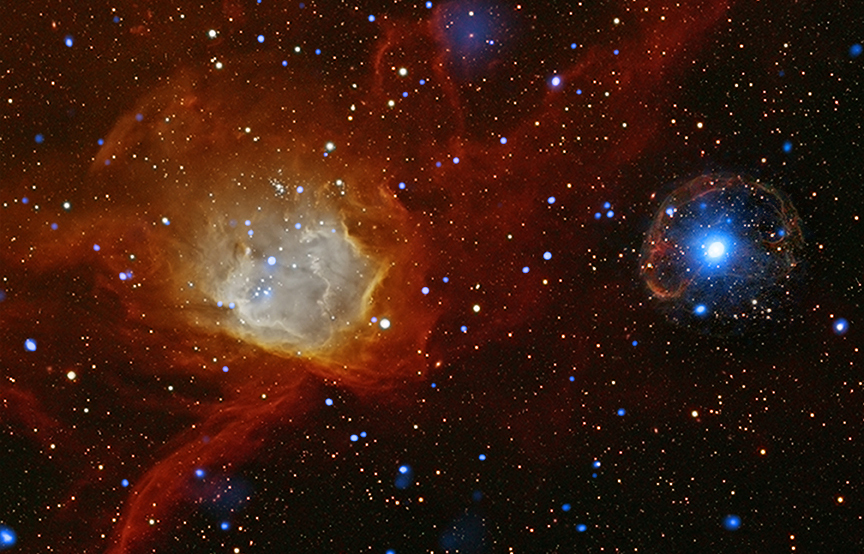
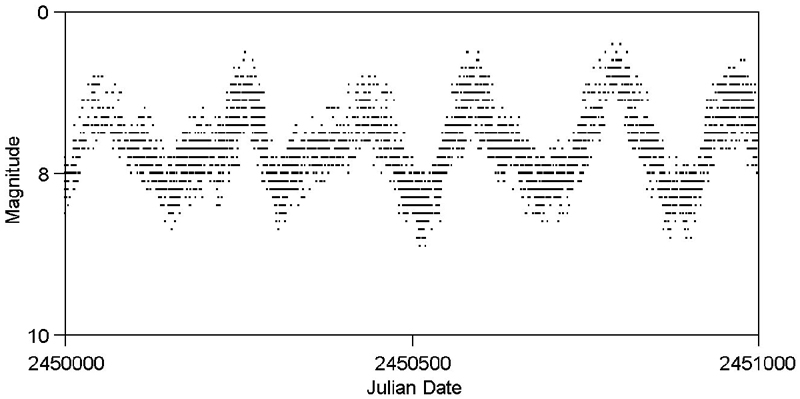
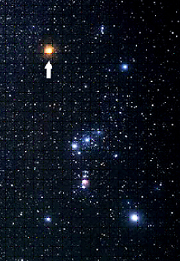 Betelgeuse in the Constellation Orion Semiregular variables are giants and supergiants showing periodicity accompanied by intervals of semiregular or irregular light variation. Their periods range from 30 to 1000 days, generally with amplitude variations of less than 2.5 magnitudes. Antares (α Scorpius) and Betelgeuse (α Orionis) are two prominent examples of LPV semiregular variable stars. These stars occupy a region of instability on the H-R diagram above the Mira variables and are generally spectral class K, M, C or S. Antares and Betelgeuse will both eventually collapse into Type II supernovas – leaving behind a remnant and a neutron star or pulsar core – possibly within the next one million years. |
The Cambridge Encyclopedia of
Stars, J B Taylor, © 2006
Many objects can not be plotted on the H-R diagram due to their extreme and complex properties – such as neutron stars, pulsars, black holes, planetary nebulas and supernova remnants. Neutron stars and pulsars are the stellar cores of supergiants that have collapsed. They have temperatures of approximately a million degrees Kelvin, and would fall far off to the left of the H-R diagram. Black holes, the end result from catastrophic collapses of the most massive stars, emit no light on their own and therefore have no absolute visual magnitude. Their surroundings may become visible if they accrete mass from a binary companion, but they still cannot be placed on an H-R diagram. Planetary nebulas are remnants comprised of illuminated material that surrounds white dwarfs. Strong stellar winds from the progenitor red giant stars and the expulsion of surface materials from the slight rebound of the core during the collapse produce planetary nebulas which continue to expand into the interstellar medium (ISM). Though planetary nebulas are sometimes shown on H-R diagrams, it is usually to show the progress of the central white dwarf star as it transitions to the white dwarf branch of the diagram – they would also fall to the left of the upper-left quadrant of the H-R diagram. As planetary nebulas continue to expand, they become more and more tenuous and after ~25,000 – 50,000 years are no longer visible. Type II supernova remnants contain materials from the progenitor star when the rebounding core meets the infalling atmospheric layers, and Type Ia supernova remnants are the materials produced from the thermonuclear destruction of a white dwarf. The remnants are complex and contain structures such as knots, filaments and shock waves and can not be plotted on the H-R diagram.
The Cambridge Encyclopedia of
Stars, J B Taylor, © 2006
H-R Diagram Instability Strips
Since stars are plotted on the H-R diagram by absolute magnitude and/or luminosity and surface temperature (stellar classification), each star is plotted as one data point. Main sequence stars, giants and supergiants, and white dwarfs all occupy specific branches on the diagram. These objects have an absolute magnitude and temperature that does not vary enough to change their spectral class. Plotting Cepheids, RR Lyrae, Mira and Semiregular pulsating variable stars on the H-R diagram is not a single plot like non-pulsating stars. During their evolution through the instability strips they are pulsationally unstable – expanding and brightening, then contracting and become dimmer. The instability strips for Miras and Cepheids are especially elongated because of these expansions and contractions. Some pulsating variable stars change in temperature by two spectral classes during one cycle from maximum to minimum. To study the complete cycle of change for individual variable stars, it is necessary to plot them twice on the H-R diagram – both at maximum absolute magnitude (MVmax) and minimum absolute magnitude (MVmin) – along with the corresponding spectral classes. NOTE: For simplification, pulsating variables are normally shown on H-R diagrams with one data point that represents their average absolute magnitudes and temperatures. The averages locate the variables on the diagram in the middle of their cycles; whereas a better understanding of these stars necessitates plotting them at both extremes of their cycles so the degree of variation is more easily seen.
Variable stars need to be systematically observed over decades in order to determine their long-term behavior. The observational data are used to analyze variable star behavior and to develop computerized theoretical models of variable stars. The nature of the variability provides information about stellar properties, such as mass, radius, luminosity, temperature, internal and external structure, composition, and evolutionary history. Variable stars play a crucial role in our understanding of the universe. Cepheids and RR Lyraes have played a major part in determining distances to galaxies and determining the age of the Universe. Mira variables give us a glimpse into the future evolution of our own star; the Sun. Accretion disks in cataclysmic variables help us to understand larger scale disk dynamics – such as processes inside active galaxies with supermassive black holes. Through nucleosynthesis, supernovas create the elements necessary for life, and are part of the process that provides the conditions for planetary formation. Variable stars are integral to the process of stellar evolution - the endless cycle of stellar formation and destruction. A complete description of the story of stellar evolution is available at the following: http://chandra.harvard.edu/edu/formal/stellar_ev/story/
Revised: March 09, 2015