
1
Labeled X-ray & Optical Image of MACSJ0717.5+3745
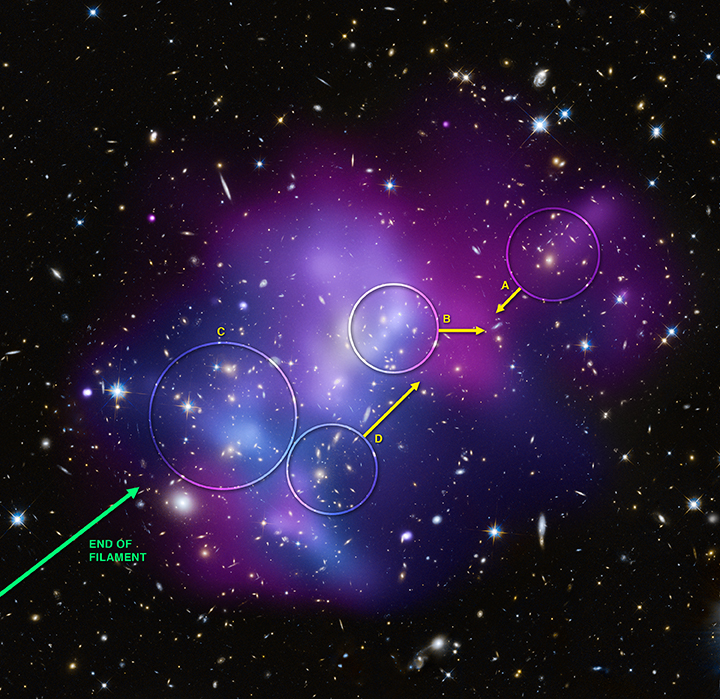
A labeled version of the MACSJ0717 image shows the galaxies in the four different clusters involved in the collision, plus the direction of motion for the three fastest moving clusters. The length of the arrow shows the approximate speed in a direction perpendicular to the line of sight. Note that the direction of motion of the clusters is roughly parallel to the direction of the filament. Data from Keck Observatory was used to derive the speed of the clusters along the line of sight, allowing the three-dimensional geometry and dynamics of MACSJ0717 to be derived.
View Animation
(Credit: X-ray (NASA/CXC/IfA/C. Ma et al.); Optical (NASA/STScI/IfA/C. Ma et al.))
2
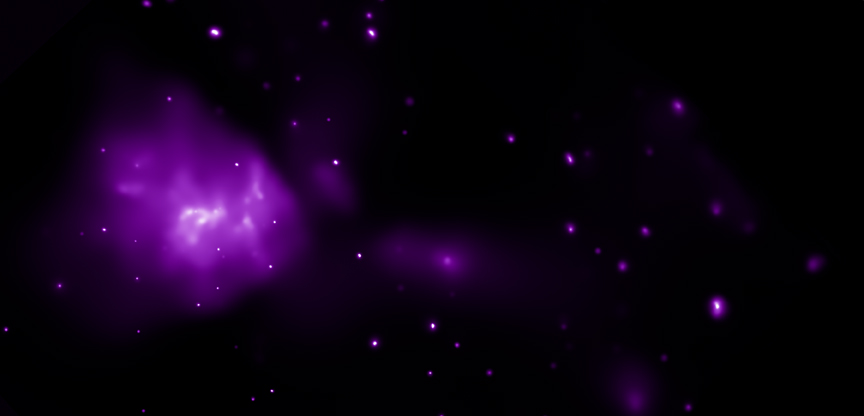
A Larger Scale Chandra View of MACSJ0717
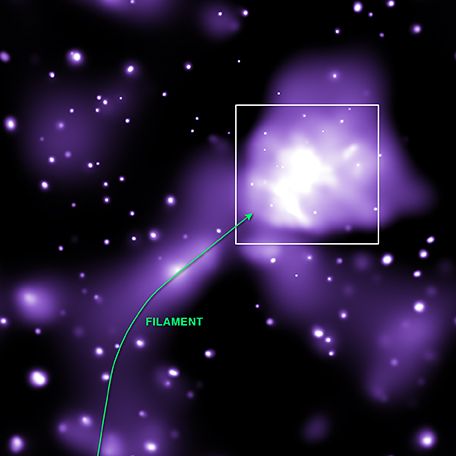
This Chandra image shows a larger scale view of the galaxy cluster MACSJ0717, where the white box shows the field-of-view of the Chandra/HST composite image. The green line shows the approximate position of the large-scale filament leading into MACSJ0717, based on analysis of the positions of galaxies using optical data (not shown here). Material flows along the filament into MACSJ0717. Faint X-ray emission is seen along the filament, showing that it contains hot gas as well as galaxies.
View Animation
(Credit: X-ray (NASA/CXC/IfA/C. Ma et al.)
3
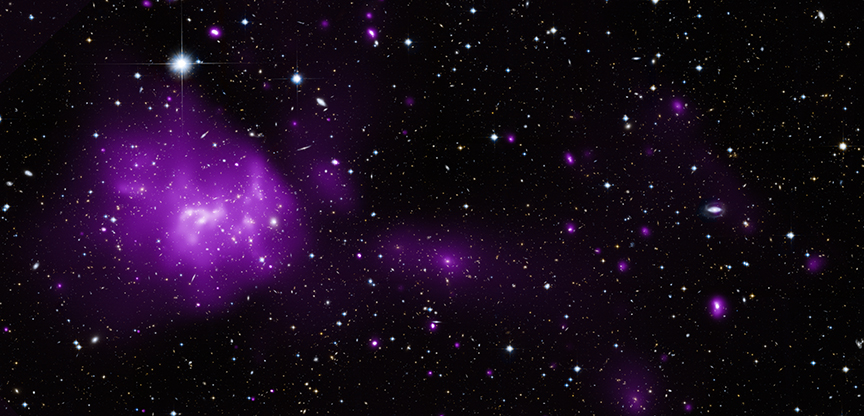
Chandra X-ray & HST Optical Images of MACSJ0717.5+3745
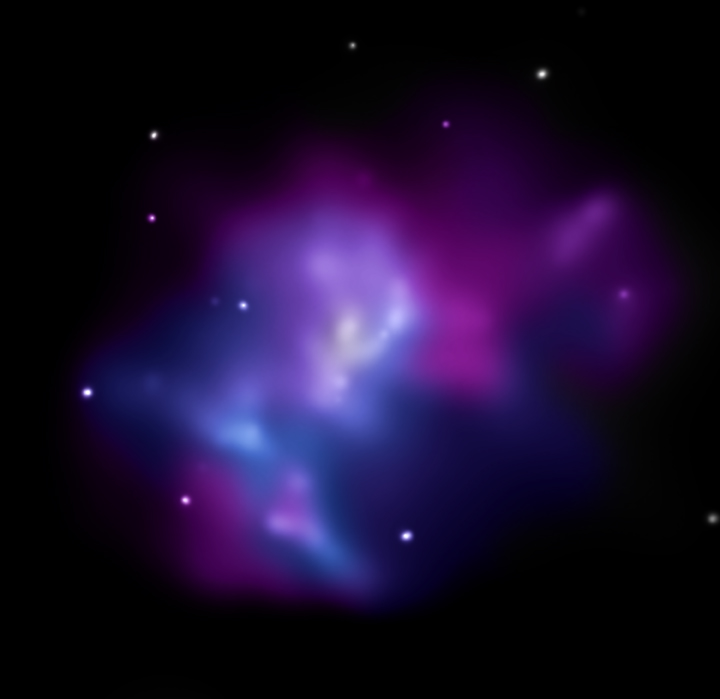
These images show the massive galaxy cluster MACSJ0717.5+3745 where four separate galaxy clusters have been involved in a collision -- the first time such a phenomenon has been documented. X-rays from Chandra reveal the cluster's hot gas, while optical data show the individual galaxies in the system. The colors show the varying temperatures found in the hot gas, where the coolest gas is reddish purple, the hottest gas is blue, and the temperatures in between are purple.
View Animation
(Credit: X-ray (NASA/CXC/IfA/C. Ma et al.); Optical (NASA/STScI/IfA/C. Ma et al.)
4
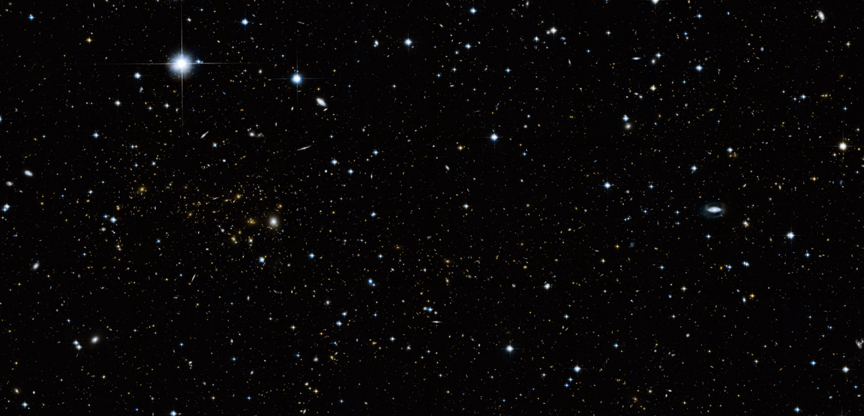
Full Field Images of MACSJ0717.5+3745
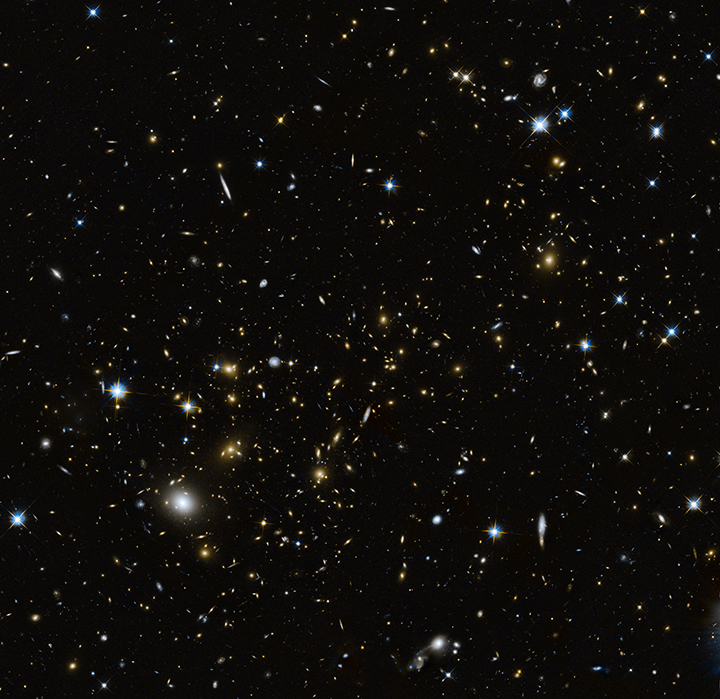
These large-field images show the massive galaxy cluster MACSJ0717.5+3745 (MACSJ0717, for short) where four separate galaxy clusters have been involved in a collision -- the first time such a phenomenon has been documented. In the composite image, data from NASA's Chandra X-ray Observatory reveal the cluster's hot gas, while an optical image from the Hubble Space Telescope shows the individual galaxies in the system.
View Animation
(Credit: X-ray (NASA/CXC/IfA/C. Ma et al.); Optical (NASA/STScI/IfA/C. Ma et al.)
5
Earth's Temperature Map
This temperature map was created using data from many different satellites orbiting the Earth, and indicates temperatures recorded on April 15, 2009. A new map is posted approximately every 6 hours. On the map, lighter shades of grey-green indicate warmer ocean temperatures, while for the land, red colors indicate more heat. The key at the bottom lists temperatures in degrees Centigrade. By contrast - following a convention in astronomy - blue colors show hotter temperatures in MACSJ0717 and red shows cooler regions. The temperatures in the cluster are measured in millions of degrees.
(Credit: GMS, GOES-8, Meteosat, SSEC, NCDC, U. Wisc., NOAA)
6
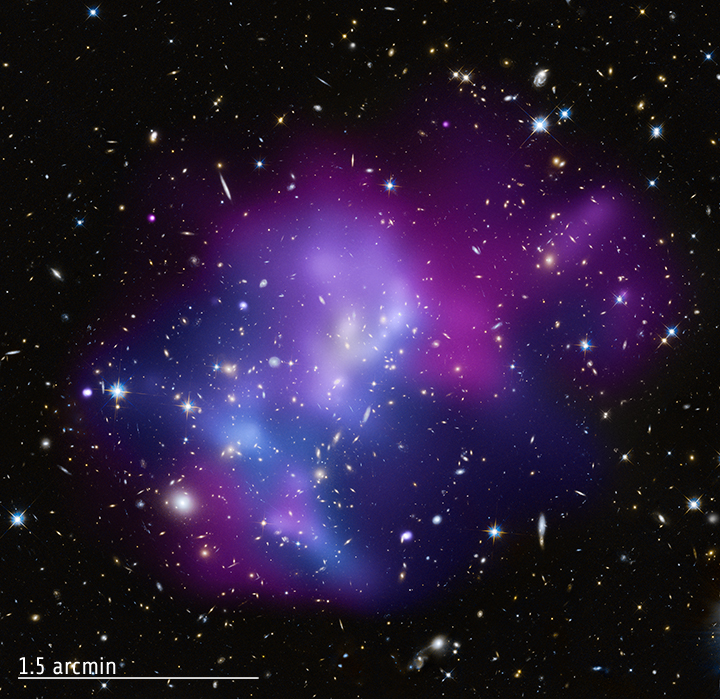
MACSJ0717.5+3745 with Scale Bar
(Credit: X-ray (NASA/CXC/IfA/C. Ma et al.); Optical (NASA/STScI/IfA/C. Ma et al.)
(Credit: X-ray (NASA/CXC/IfA/C. Ma et al.); Optical (NASA/STScI/IfA/C. Ma et al.)
MACSJ0717.5+3745 (April 16, 2009)

Revised: November 30, 2022